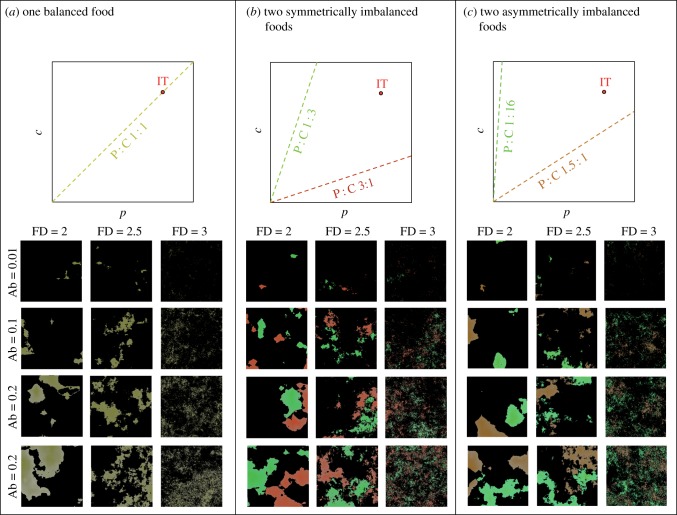
Figure 1.
Each environment contains one or two foods defined by their protein to carbohydrates ratio (P : C), abundance (Ab) and fractal dimension (FD). Upper panels show schematic of nutritional geometry, in which foods are represented as nutritional rails (dashed lines) in a two-dimensional nutritional space (p,c) defined by protein and carbohydrates. The challenge for an individual is to eat foods in amounts and proportions that enable it to reach its intake target (IT; a position in the nutritional space that maximizes fitness). Lower panels show examples of two-dimensional landscapes for each environment type, and for all combinations of ABs and FDs tested. Colours reflect the nutrient content of foods (scaled from red = high P to green = high C). The total amount of coloured pixels reflects the Ab of the food. (a) Environment containing a single balanced food whose nutritional rail intersects the IT. Individuals can reach their IT by eating from this food. (b) Environment containing two individually imbalanced but collectively complementary foods whose nutritional rails fall symmetrically on opposite sides of the IT. Individuals can reach their IT by eating an equal amount of both foods. (c) Environment containing two imbalanced but complementary foods whose nutritional rails fall asymmetrically on opposite sides of the IT (same angular difference as in b). Individuals can reach their IT by eating three times more of P : C 1.5 : 1 than P : C 1 : 16.

