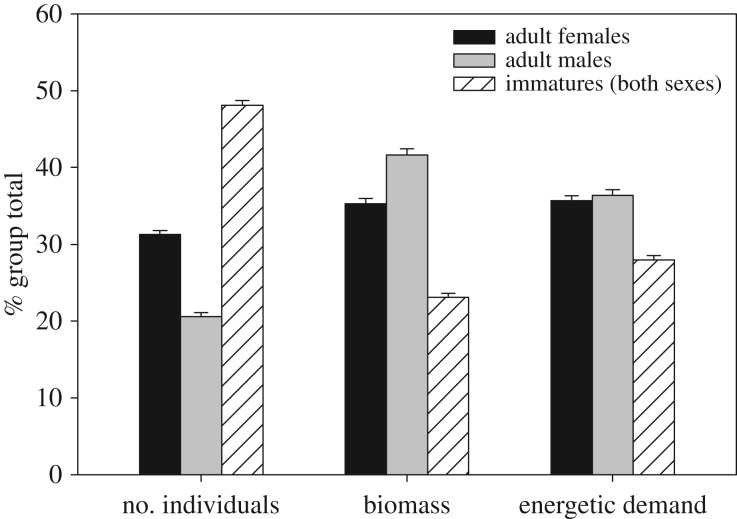
Figure 2.
Per cent contribution by age–sex class to group's total number of individuals, biomass (kg) and energetic demand (kg3/4) for 14 baboon social groups from 1990 to 2014 hydrological years (November–October). Analyses included only group-hydrological years in which the focal group was censused every calendar month during the hydrological year. Data provided by ABRP.

