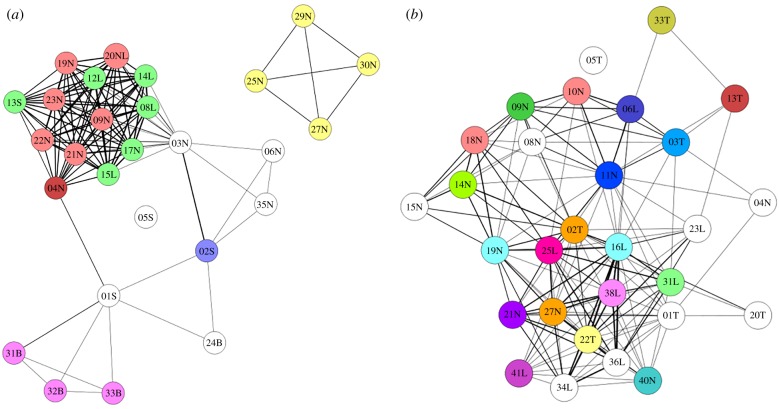
Figure 2.
Static social networks of Grevy's zebras (a) and onagers (b). Lines depict edges showing social connections among individuals identified by numbers and reproductive state (S, stallion; B, bachelor male; T, territorial (breeding) male; N, non-lactating female; L, lactating female). The colourings represent communities identified by dynamic social network analysis [46]. In a dynamic network, a community is very similar to a module in a static network.

