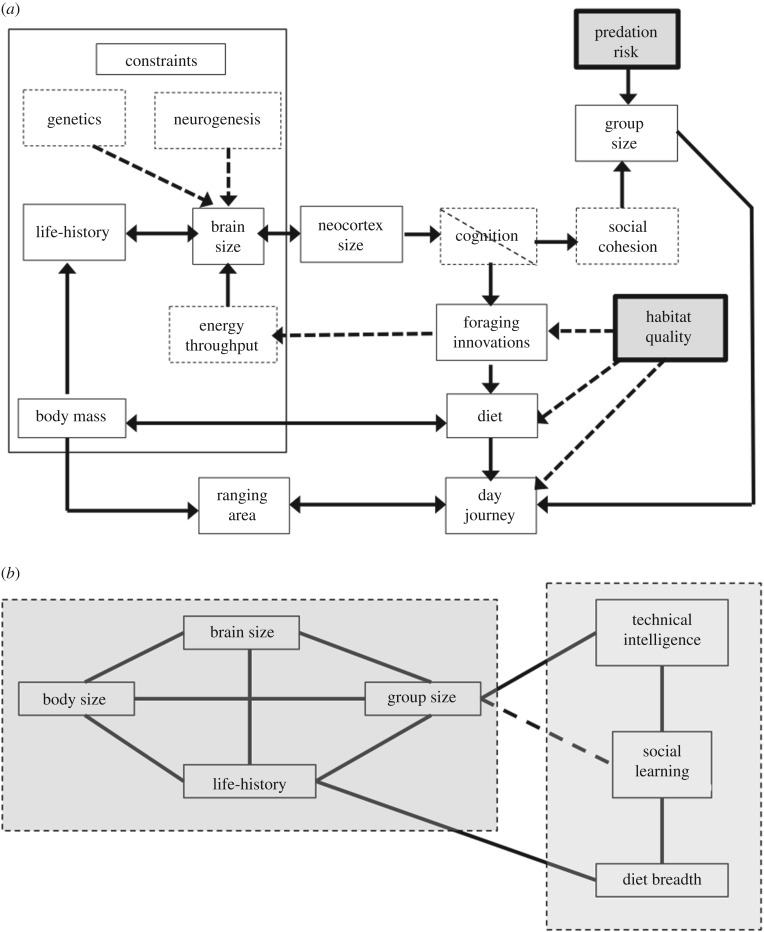
Figure 2.
(a) Path model of Dunbar & Shultz [6] defining the relationships between key variables in primate social, ecological and brain evolution. Solid lines indicate statistically confirmed relationships based on the phylogenetically controlled path analysis given by Dunbar & Shultz [6]; dotted lines indicate additional relationships not included in the original path analysis but for which there is confirmatory statistical evidence. Boxes with dashed outlines indicate variables not included in the original path analysis of [6]. Shaded boxes indicate major environmental drivers. (b) Path model of Navarette et al. [52]. Lines indicate phylogenetically controlled statistically significant relationships. Technical intelligence here refers to a combination of foraging innovations and extractive foraging. In some (but not all) models, social learning correlates with social group size (dashed line). Dashed boxes enclose variables that covary together. The graph is redrawn to a similar orientation to that in (a).

