Figure 1.

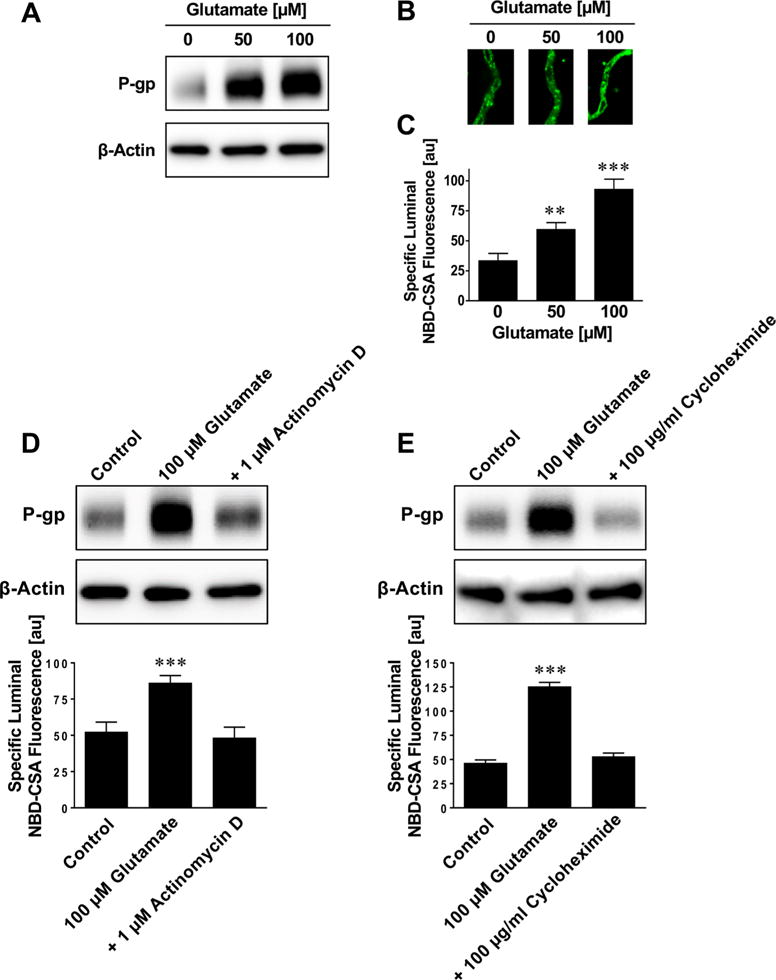
Glutamate upregulates P-glycoprotein in brain capillaries ex vivo. (A) Western blot showing that glutamate increases P-gp protein expression levels in crude membranes isolated from brain capillaries. β-Actin was used as protein loading control. Isolated brain capillaries were exposed to 50–100 μM glutamate for 30 min then incubated in glutamate-free medium for 5 1/2 h followed by capillary membrane isolation. (B) Representative confocal microscopy images of isolated brain capillaries that were first exposed to 50–100 μM glutamate for 30 min followed by 5 1/2 h in glutamate-free medium, and then exposed to the fluorescent P-gp substrate NBD-cyclosporin A (NBD-CSA; marker for P-gp transport activity). NBD-CSA fluorescence in the capillary lumen increases with increasing glutamate concentration, indicating an increase in P-gp transport activity. (C) Specific NBD-CSA fluorescence in the capillary lumen increases with increasing glutamate concentration. Data were obtained through analysis of the confocal images in B. Specific NBD-CSA fluorescence is the difference between total luminal fluorescence and fluorescence in the presence of the specific P-gp inhibitor PSC833, thus representing specific P-gp transport activity. (D) Actinomycin D, a transcription inhibitor, and (E) cycloheximide, a translation inhibitor, block the effect of glutamate. Data are mean ± SEM (n =10–15 capillaries per treatment group from one brain capillary isolation; pooled tissue from 10 rats). Units are arbitrary fluorescence units (scale, 0–255). Statistical comparison (one-way ANOVA): **, significantly higher than controls, p < 0.01; ***, significantly higher than controls, p < 0.001.
