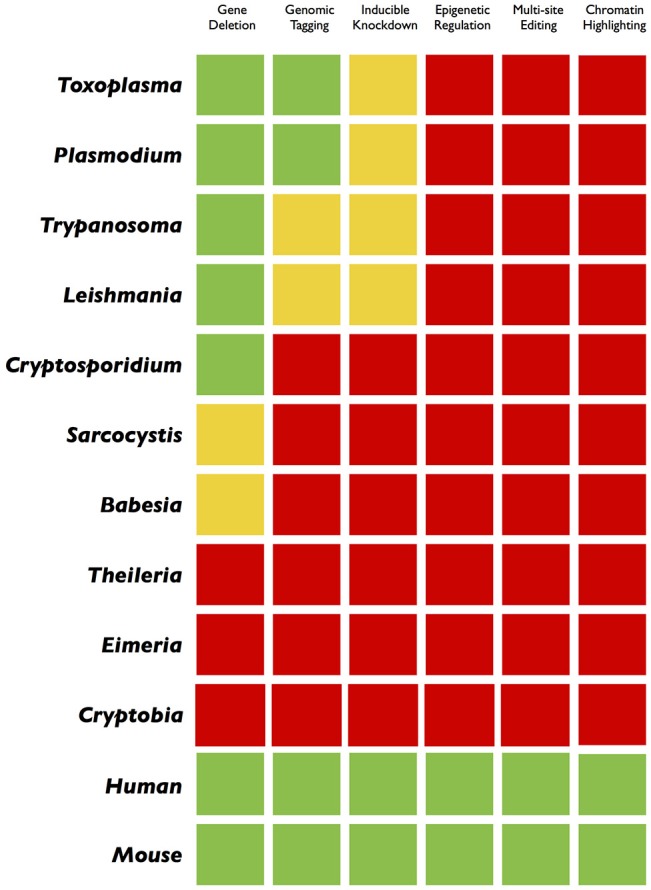
Figure 3.

Traffic light gradient depiction of genome engineering applications in parasites and mammalian cells. A comparative color-coding indicates the current progress in different organisms. The green and red colors display a “comprehensive” or “not-at-all” scenario, respectively. The yellow light reflects an incremental success achieved through customary methods. While the green and yellow colors in model parasites encourage for more innovative applications (inducible gene silencing, epigenetic/epigenomic studies, multi-site editing), the widespread red color, mostly in non-model pathogens, advocates for a systematic application of the CRISPR technology.
