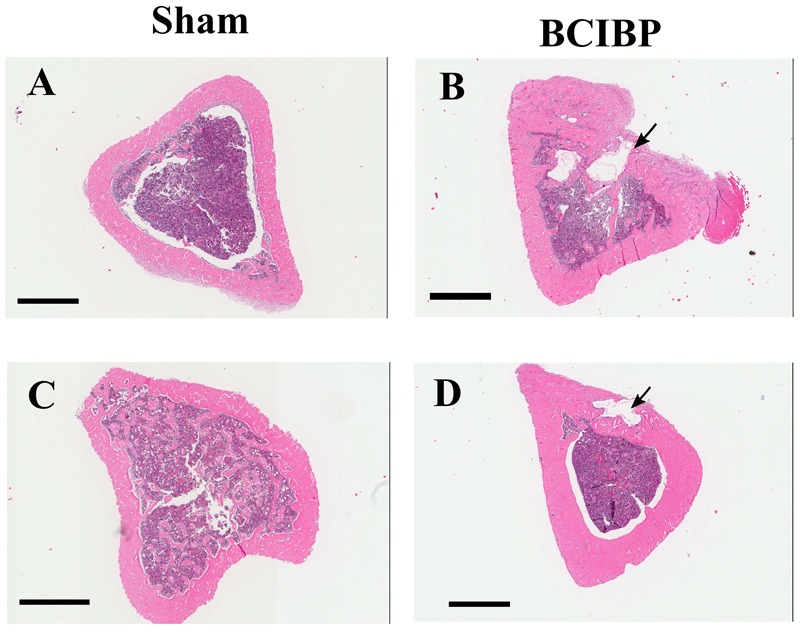
FIGURE 10.

Histological assessment of tibiae from BCIBP rats and corresponding sham rats. Panels in the figure show representative images of H&E staining of tibial sections of (A) sham rat at day 10 post-ITI, (B) BCIBP rat at day 10 post-ITI, (C) sham rat at day 48 post-ITI and (D) BCIBP rat at day 48 post-ITI. Black arrowheads show destruction of cortical bone of tibiae. Scale bar – 1 mm.
