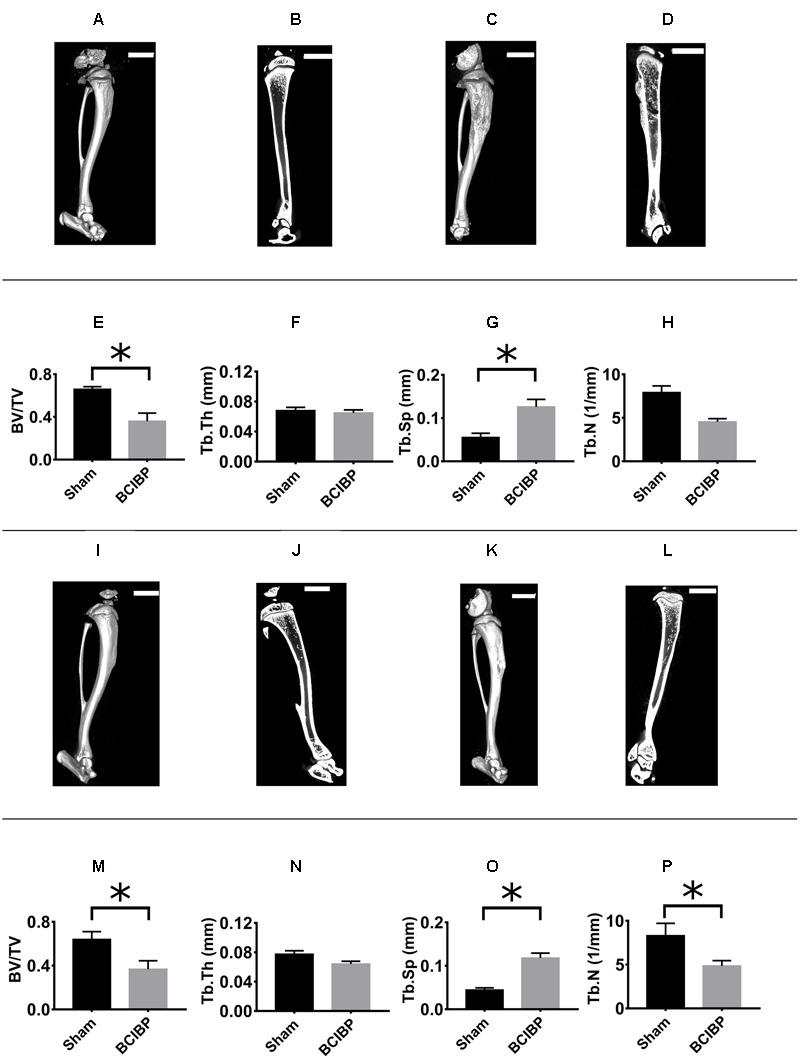
FIGURE 9.

Radiological assessment of tibiae from BCIBP rats and corresponding sham rats. Panels in the figure show (A) 3D-μCT radiological image of a sham rat’s tibia at day 10 post-ITI, (B) trabecular bone of a sham rat’s tibia at day 10 post-ITI, (C) 3D-μCT radiological image of a BCIBP rat’s tibia at day 10 post-ITI, (D) trabecular bone of a BCIBP rat’s tibia at day 10 post-ITI, (E–H) morphometric changes in BCIBP rats’ tibiae relative to sham rats’ tibiae at day 10 post-ITI, (I) 3D-μCT radiological image of a sham rat’s tibia at day 48 post-ITI, (J) trabecular bone of a sham rat’s tibia at day 48 post-ITI, (K) 3D-μCT radiological image of a BCIBP rat’s tibia at day 48 post-ITI, (L) trabecular bone of a BCIBP rat’s tibia at day 48 post-ITI, (M–P) morphometric changes in BCIBP rats’ tibiae relative to sham rats’ tibiae at day 48 post-ITI. ∗p ≤ 0.05 (Two-way ANOVA, post hoc Bonferroni test). Scale bar – 5 mm.
