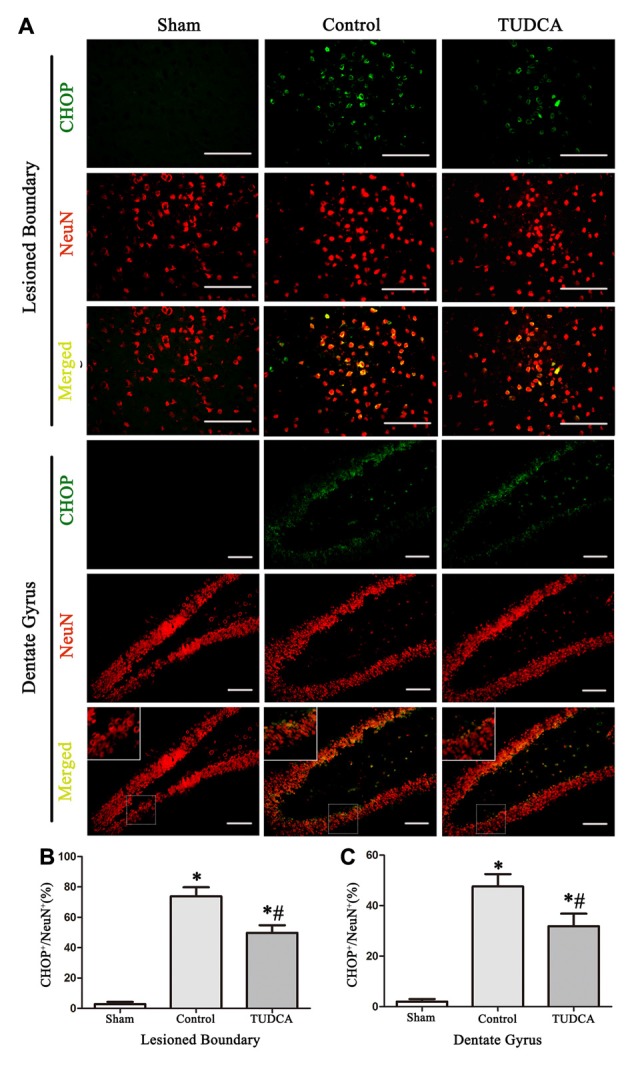
Figure 6.

Effects of TUDCA on the CHOP-positive neuronal cells at 72 h after TBI. Representative immunofluorescences images showing the colocalization of CHOP (green) with NeuN positive cells (red) in the lesion area of the cerebral cortex and the dentate gyrus of the ipsilateral hippocampus at 72 h after TBI (A). Quantitative data indicating that the expression of CHOP in neuronal cells was greater in TBI group than in TUDCA treated group both in the lesion area (B) and in the dentate gyrus (C). All the results are expressed as the mean ± SEM, and n = 5 for each group. *p < 0.05 vs. sham; #p < 0.05 vs. control. Scale bar = 50 μm.
