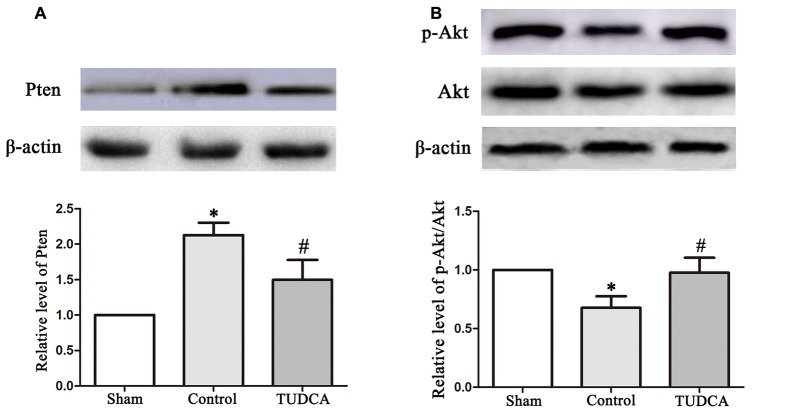
Figure 8.
Effects of TUDCA on the expression of Pten and the ratio of p-Akt/Akt. Representative results of Pten (A), p-Akt/Akt (B) alterations in the different groups. β-actin was used as the loading control. All the results are expressed as the mean ± SEM, and n = 5 for each group. *p < 0.05 vs. sham; #p < 0.05 vs. control.

