Figure 1.

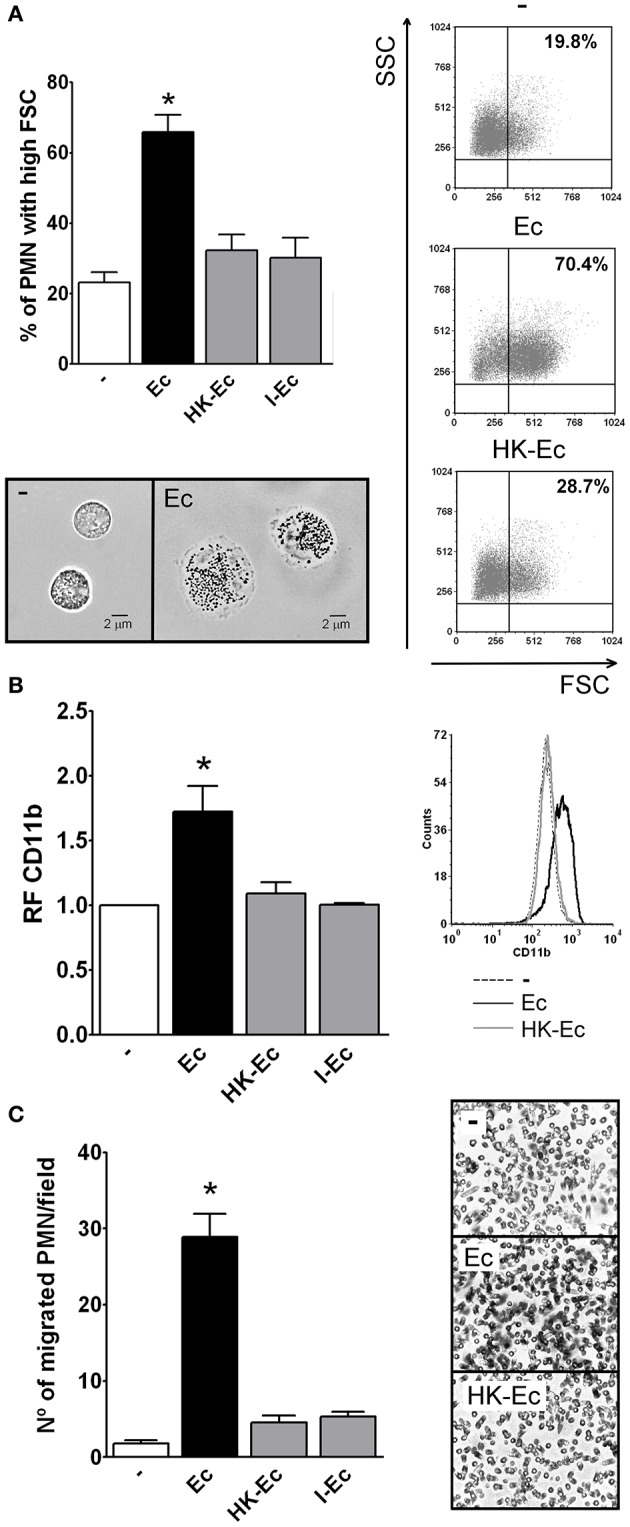
Live bacteria triggers the first steps of PMN activation. Isolated PMN were treated with live bacteria or bacteria killed by different methods in a PMN:bacteria ratio of 1:20 for 30 min. (A) The % of PMN that increased their FSC after stimulation with live E. coli (Ec), heat-killed Ec (HK-Ec), irradiated Ec (I-Ec), or left untreated (−) was determined by flow cytometry. Results were expressed as the mean ± ES, n = 14. Right panel: representative dot-plots showing SSC vs. FSC profiles of PMN with no treatment (−), Ec, and HK-Ec. Lower panel: Representative microphotographs of untreated PMN and PMN stimulated with Ec (x1,000). (B) Expression of CD11b. The mean fluorescence intensity (MFI) of the adhesion marker CD11b was determined by flow cytometry. Results were expressed as the mean ± ES of the relative fluorescence (RF) of the MFI of the different treatments with respect to untreated PMN, n = 8. Right panel: Representative histogram of the expression of CD11b in non-treated (−), Ec or HK-Ec-treated PMN. (C) Chemotactic response using a Boyden chamber. The number of PMN that have migrated through a 3 μm-pore membrane using Ec, HK-Ec, or I-Ec as stimulus is shown. Results were expressed as the mean ± ES, n = 8. Right panel: Representative microphotographs showing stained nuclei of PMN that migrated through the membrane with no treatment (−), Ec and HK-Ec (x1,000). In all cases *p < 0.05 vs. all other groups.
