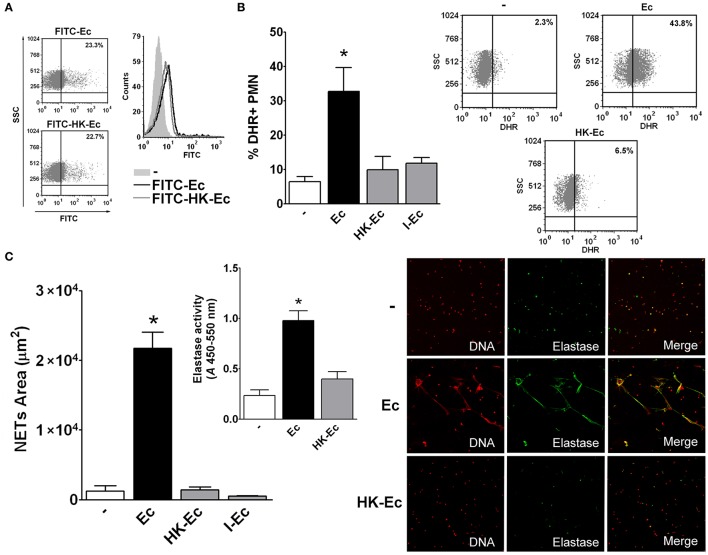
Figure 2.
Live bacteria is critical for triggering bactericidal responses. (A) Phagocytosis of FITC-Ec or FITC-HK-Ec was determined after 60 min by flow cytometry. Dot plots showing the percentage and a histogram showing the MFI of FITC+ PMN of a representative experiment out of three are depicted. (B) ROS generation. Isolated PMN were stained with DHR for 15 min and then treated with Ec, HK-Ec, or I-Ec in a PMN:bacteria ratio of 1:20 for 30 min. The % of DHR+ PMN was determined by flow cytometry. Results were expressed as the mean ± ES, n = 8. Right panel: Representative dot-plots of the percentage of DHR+ PMN are shown in non-treated (−), Ec and HK-Ec-treated PMN. (C) Isolated PMN were incubated with Ec, HK-Ec, or I-Ec in a PMN:bacteria ratio of 1:20 for 3 h and NETs were stained with propidium iodide for DNA and with a specific antibody for elastase detection and were visualized by confocal microscopy. NETs area (μm2) was measured using the FIJI software as described in material and methods. Results were expressed as the mean ± ES, n = 10. Inset: Elastase activity using a specific substrate was determined and the absorbance (A) at 450–550 nm is depicted for untreated PMN (−) and PMN treated with Ec or HK-Ec. Results were expressed as the mean ± ES, n = 10. Right panel: Representative microphotographs of confocal images showing PMN from the untreated (−), Ec and HK-Ec groups stained for DNA or elastase visualization and the merge of the images (x200). In all cases *p < 0.05 vs. all other groups.

