Figure 6.
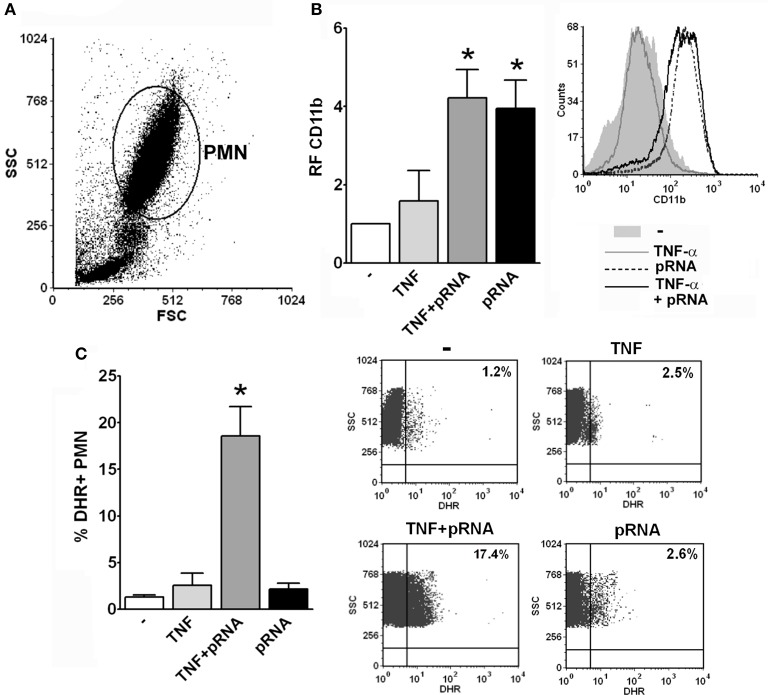
pRNA-induced ROS requires priming. (A) Representative dot-plot showing the SSC vs. FSC profile of the different populations observed in whole blood assays after lysis of erythrocytes using a commercial lysing buffer. The PMN population is indicated. (B) Whole blood was incubated with pRNA and/or the priming stimulus, TNF-α, for 30 min and the expression of CD11b was measured by flow cytometry within the gate of PMN. A histogram of one representative experiment out of three is shown. (C) Whole blood was incubated with DHR for 15 min and with the different stimuli for additional 30 min. The % of DHR+ PMN was determined by flow cytometry within the gate of PMN. Dot-plots of the percentage of DHR+ PMN of one representative experiment out of three are shown. In all cases *p < 0.05 vs. all other groups.

