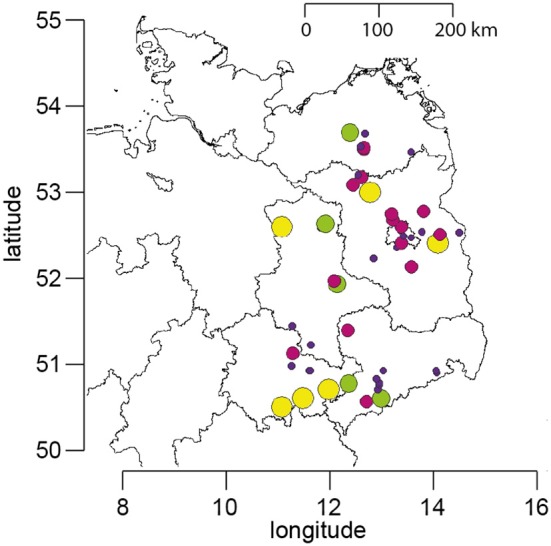
Figure 1.

Map of Northeast Germany showing the location of the apiaries which participated in the study. The size and color of the circles represent the number of years for which data are available for each apiary (yellow, 12 years; green, 9–11 years; purple, 5–8 years; blue, 1–4 years).
