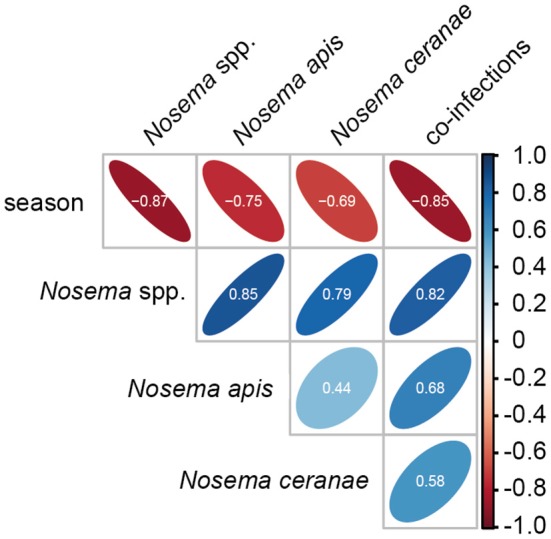
Figure 3.

Spearman correlation matrix values showing the pairwise correlation coefficients for the parameters season and the four infection categories (Nosema spp.-, N. apis-, N. ceranae-, and co-infections). Shape and orientation of the ellipses represent the data clouds of the respective correlation coefficients. Positive correlations are illustrated in blue and negative correlations in red. Coefficients (white digits) between |0.10| and |0.29| represent weak associations, coefficients between |0.30| and |0.49| represent medium associations and coefficients of |0.50| or above (beyond) represent strong associations.
