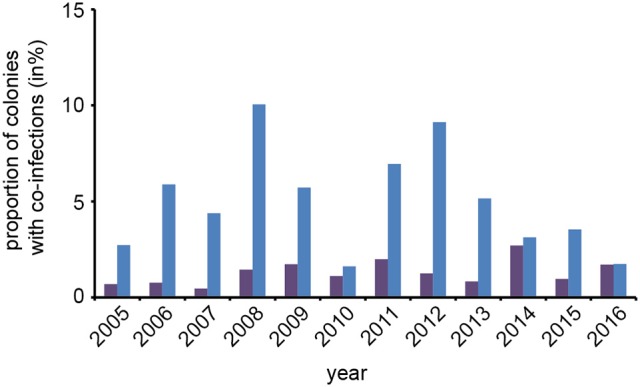
Figure 4.

Predicted and observed frequencies of prevalence of colonies being co-infected in spring with N. apis and N. ceranae. Predicted values for co-infections (violet bars) were calculated from the observed frequencies of N. apis- and N. ceranae-infected colonies and compared to the observed values for co-infection prevalence (blue bars) for each spring between 2005 and 2016.
