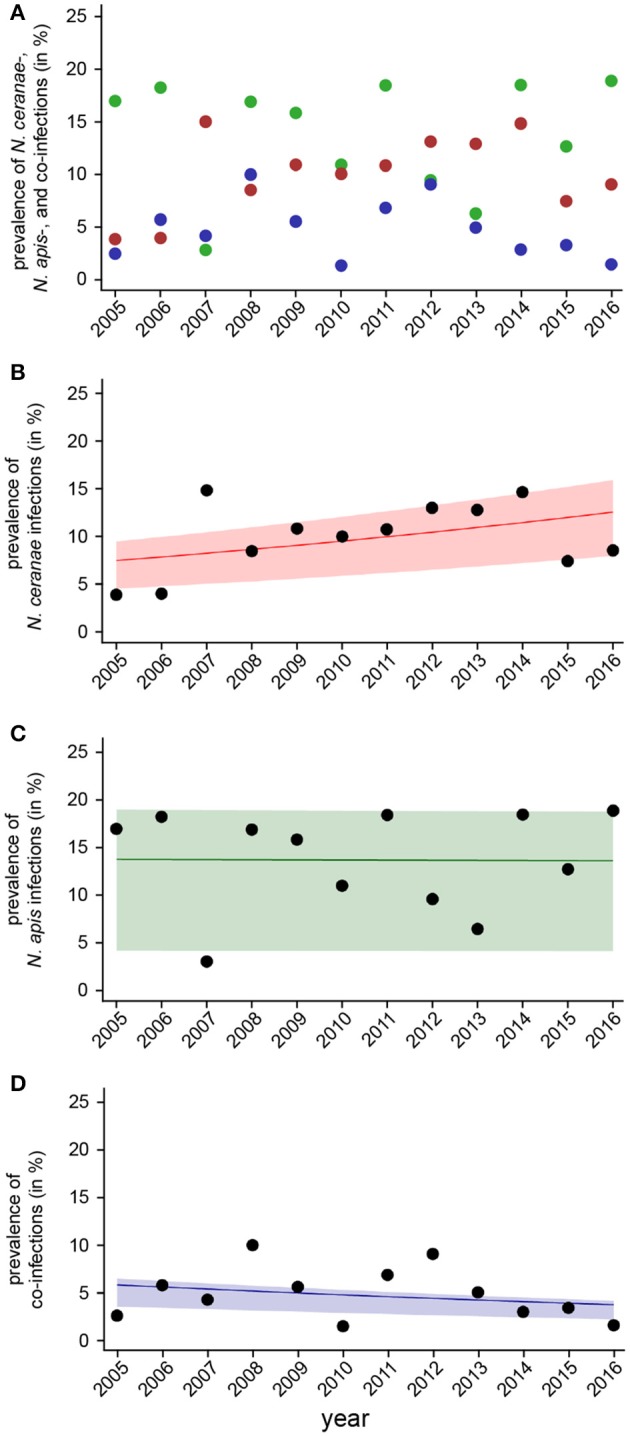
Figure 5.

Temporal patterns of prevalence of single infections with N. ceranae or N. apis and of co-infections detected in spring samples between 2005 and 2016. (A) Prevalence data for N. ceranae-, N. apis-, and co-infections in spring are plotted against year. (B) Data sets for prevalence of N. ceranae-, N. apis-, and co-infections in spring were fitted by Linear Mixed-Effects Models to visualize the relationship between the independent variables (year) and the dependent variables N. ceranae- (B), N. apis- (C), and co-infections (D). Regression lines visualizing trends for N. ceranae- (B; solid red line), N. apis- (C; solid green line), and co-infection (D; solid blue line) prevalence are shown; ribbons represent the 2nd and 3rd quartile (25–75%) of the predicted data of the model.
