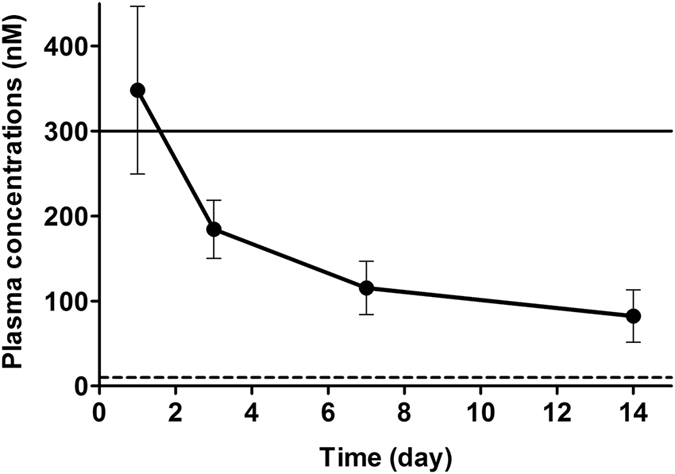
Figure 2.

Plasma concentration of C-1 in mice after administration of sustained-release pellets of C1. Plasma concentrations of C-1 are shown as the mean with SD (n = 10). The upper solid line represents a concentration of 300 nM, at which C-1 did not show an agonistic activity for ERα in vitro. The lower dashed line represents a concentration of 10 nM, at which C-1 shows full agonistic activity equal to that of E2 for ERβ in vitro.
