
Figure 4.
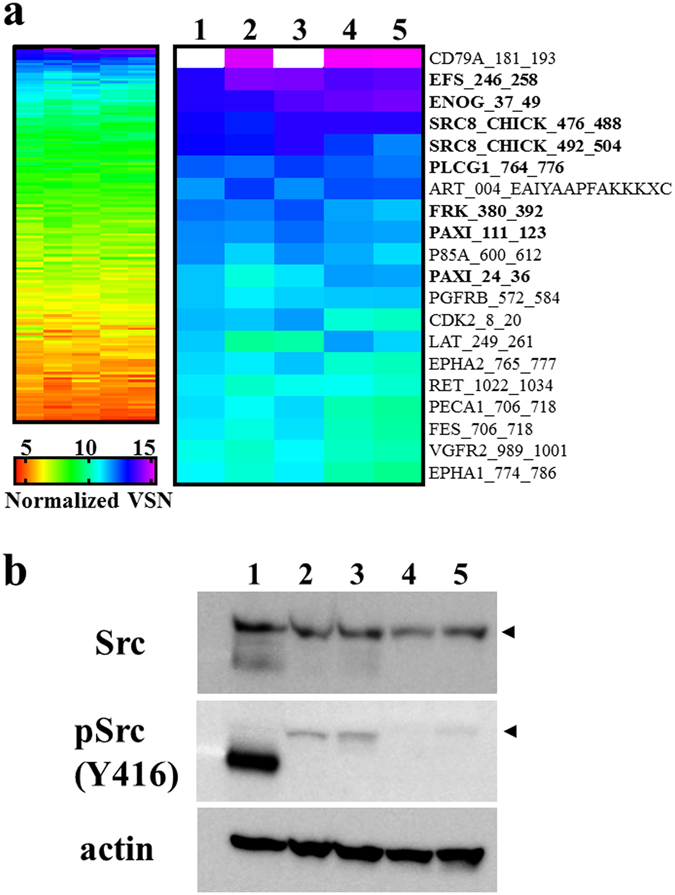
Tyrosine kinase activity in primary tumour, xenograft tumours, and the cell lines. (a) Tyrosine kinase activity detected with an array of peptide substrate is fully shown in the left panel and the signal intensities of the top 20 peptides are shown in the right panel. 1: tumour tissue, 2: NCC-CDS1-X1 tumour tissue, 3: NCC-CDS1-X3 tumour tissue, 4: NCC-CDS1-X1-C1 cells, 5: NCC-CDS1-X3-C1 cells. (b) Western blotting analysis of Src. Arrowheads indicate the position of Src with a molecular weight of 60 kDa. Full-length blots are shown in Supplementary Fig. S3.