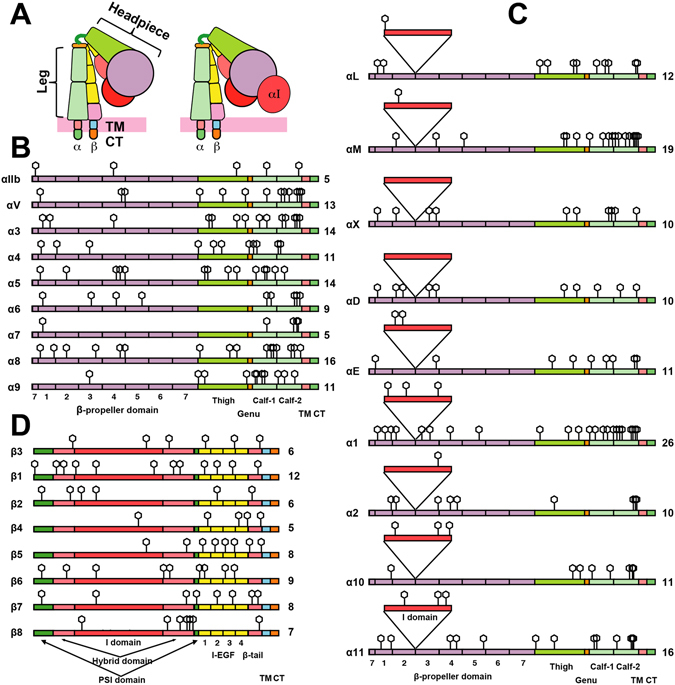
Figure 1.

Integrin structure and N-linked glycosylation. (A) Cartoon models of integrin in the bent conformation. The domains are color-coded as same as panels B–D. (B,C) The distribution of potential N-glycan sites in the integrin α subunits without (B) or with (C) the αI-domain. The 7 blades of β-propeller domain are labeled. (D) The distribution of potential N-glycan sites in the integrin β subunits. The numbers of predicted N-linked glycosylation sites are shown on the right for each integrin subunit.
