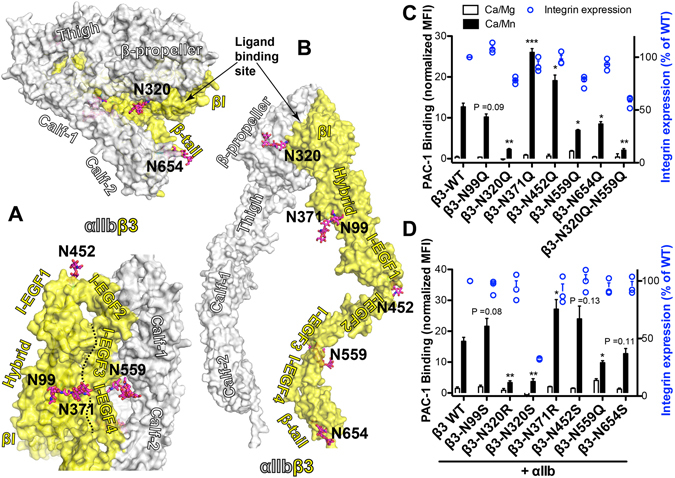
Figure 3.

Effect of the individual N-glycan deletion of β3 subunit on αIIbβ3 ligand binding. (A) Locations of the β3 N-glycan sites in the crystal structure of αIIbβ3 (PDB code 3FCS) at the bent conformation shown as the solvent accessible surface in two views. The boundary of the hybrid/I-EGF3-4 domain interface is indicated as a black dotted line. (B) Model of the high affinity extended conformation of αIIbβ3. Asn residues are shown as sticks with carbons in cyan. N-glycan groups resolved in the crystal structure are shown as sticks with carbons, oxygens, and nitrogens in magenta, red, and blue, respectively. (C,D) Ligand-mimetic mAb PAC-1 binding of the indicated single mutations of β3 co-expressed with αIIb in HEK293FT cells in the presence of 1 mM Ca2+/Mg2+ (Ca/Mg) or 0.2 mM Ca2+ plus 2 mM Mn2+ (Ca/Mn). PAC-1 binding was measured by flow cytometry and presented as mean fluorescence intensity (MFI) normalized to integrin expression (AP3 binding). Data are means ± s.e.m. (n ≥ 3). Two-tailed t-tests were used to compare the wild type (WT) and the mutants in the Ca/Mn condition. *P < 0.05; **P < 0.01; ***P < 0.001.
