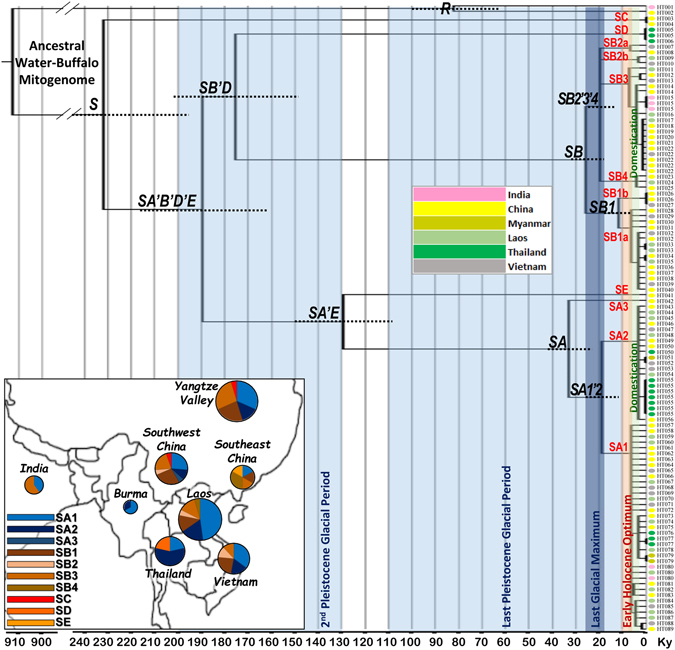
Figure 1.

Phylogeny of complete mtDNAs from 111 buffalo mitogenomes. The topology was inferred by maximum parsimony (Supplementary Dataset S2). A maximum likelihood time scale, based on synonymous substitutions, is indicated below the tree. The standard error for the major nodes are represented by dot lines, further details are available in Table 1. Samples are indicated by 89 different haplotype IDs (Supplementary Dataset S1). The insert shows the geographic distribution of major haplogroups based on these complete mtDNAs. Samples from China have been divided into three regions (Yangtze Valley, Southwest China and Southeast China). The map has been drawn by hand in Adobe Photoshop (v. 8.0; http://www.adobe.com).
