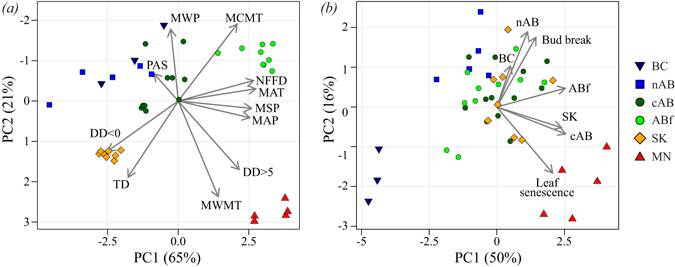
Figure 2.

Principal components analyses for climate conditions at seed source locations (a) and multi-trait measurements in common garden trials (b). Vector labels represent the input variables. Symbols in (a) represent the geographic location of provenances; symbols in (b) represent the provenance collections. Vector labels in (a): PAS = precipitation as snow (mm), MWP = mean winter precipitation (°C), MCMT = mean coldest month temperature (°C), NFFD = number of frost free days, MAT = mean annual temperature (°C), MSP = mean summer precipitation (mm), MAP = mean annual precipitation (mm), DD > 5 = degree-days above 5 °C (growing degree-days), MWMT = mean warmest month temperature (°C), TD = temperature difference between MCMT and MWMT (or continentality, °C), DD < 0 = degree-days below 0 °C (chilling degree-days); Vector labels in (b): BC = height at British Columbia test site, nAB = height at northern Alberta test site, ABf = height at Alberta Foothills test site, SK = height at Saskatchewan test site, cAB = height at central Alberta test site, Bud break = timing of bud break at central Alberta test site, Leaf senescence = timing of leaf senescence at central Alberta test site.
