Figure 4.
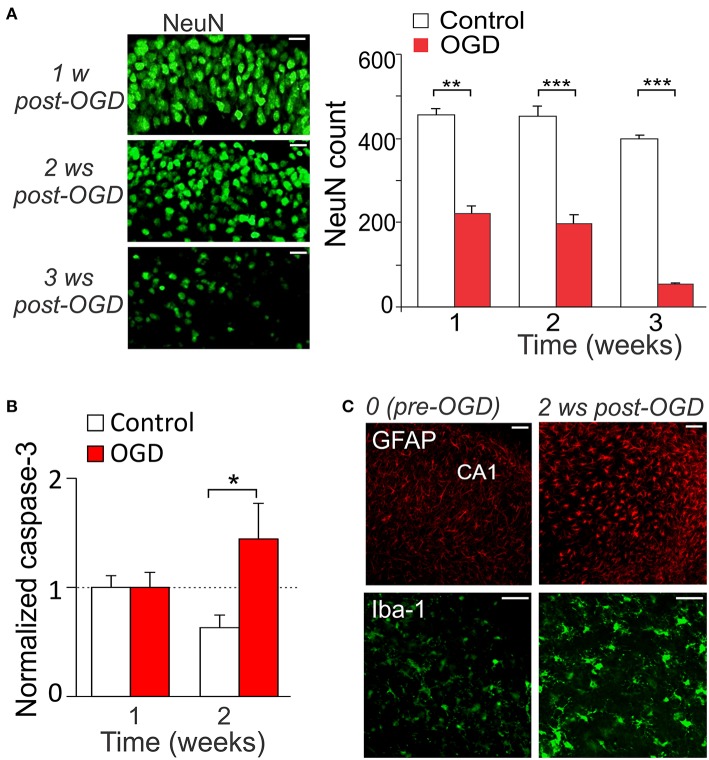
Mild OGD triggers the delayed CA1 neuronal death. (A) Immunohistology with the neuronal marker, NeuN (left images), and quantitative analysis of the NeuN-positive cells in CA1 area in control (n = 7 slices) and after mild OGD (n = 7 slices exposed to 10-min OGD; right graphs). Scale bar, 20 μm. Data are mean with s.e.m. (B) Quantitative analysis of the caspase-3-positive cells in control (n = 4) and 1–2 weeks post-OGD (n = 10 slices exposed to 10-min OGD). The numbers of fluorescent-labeled cells are normalized to the correspondent value at 1 week post-OGD. (C) Immunohistology with the astrocytic marker, GFAP, and the microglial marker, Iba-1, before and 2 weeks after mild OGD. Scale bar, 50 μm. *P < 0.05, **p < 0.01, ***p < 0.001 (unpaired t-test compared with corresponding control as indicated).

