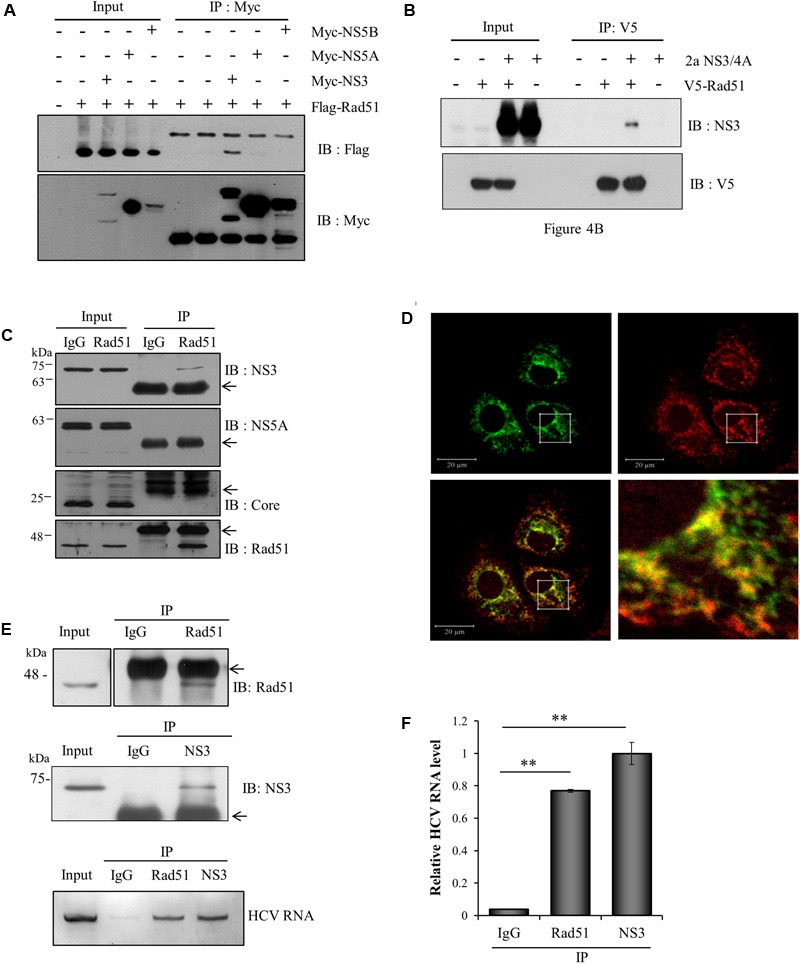
FIGURE 4.

Rad51 interacts with both NS3 protein and HCV RNA. (A) HEK293T cells were cotransfected with each of Myc-tagged genotype 1b HCV protein expressing plasmid and Flag-tagged Rad51 as indicated. At 48 h after transfection, total cell lysates were immunoprecipitated with an anti-Myc antibody and then bound proteins were detected by immunoblot analysis using an anti-Flag antibody. Protein expressions of Myc-tagged NS3, NS5A, and NS5B in the same cell lysates were verified by immunoblot analysis using an anti-Myc antibody. (B) HEK293T cells were cotransfected with V5-tagged Rad51 and NS3/4A (genotype 2a) expressing plasmid. At 48 h after transfection, total cell lysates were immunoprecipitated with an anti-V5 antibody, and bound proteins were detected by immunoblot analysis using an anti-NS3 antibody. (C) Huh7.5 cells were infected with Jc1 (MOI = 1) for 4 h. At 72 h post-infection, total cell lysates were immunoprecipitated with either control IgG or an anti-Rad51 antibody and then bound proteins were detected by immunoblot analysis using the indicated antibodies. Arrows denote IgG. (D) Huh7.5 cells infected with Jc1 were fixed in 4% paraformaldehyde. Immunofluorescence assay was performed by using an anti-Rad51 polyclonal antibody and TRITC-conjugated donkey anti-mouse IgG to detect endogenous Rad51 (red); a rabbit anti-NS3 antibody and fluorescein isothiocyanate-conjugated goat anti-rabbit IgG were used to detect NS3 (green). Dual staining showed colocalization of endogenous Rad51 and NS5A as yellow fluorescence in the crop image. (E) (Upper) Huh7.5 cells were infected with Jc1. At 72 h post-infection, post-nuclear supernatants were prepared by centrifugation at 10,000 × g. The sample was lysed and immunoprecipitated with control IgG, anti-Rad51 antibody, and anti-NS3 antibody, respectively. Arrows indicate IgG. (Lower) HCV RNAs extracted from the protein-RNA complex were analyzed by qRT-PCR using HCV-specific primers. NS3 was used as a positive control. (F) HCV RNA levels in protein-RNA complex were quantified by qRT-PCR. The asterisks indicate significant differences (∗∗p < 0.01) from the value for the IgG control. Experiments were carried out in triplicate. Error bars indicate standard deviations.
