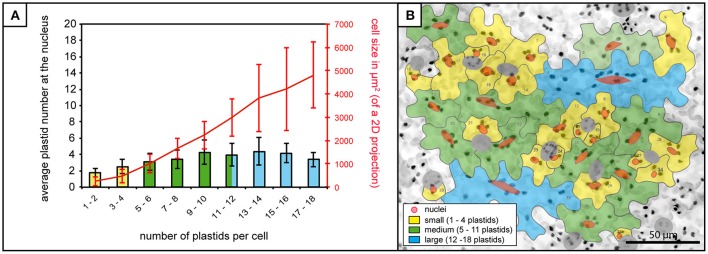
Figure 2.
Plastid-nucleus association in A. thaliana rosette leaf upper epidermis. (A) Bars represent the average number of plastids at the nucleus in cells of increasing plastid number (x-axis), while the red line represents accompanying increases in average cell size. Bars colors match cell size categories, small (yellow), medium (green) and large (blue) cells as shown in (B). Error bars represent standard deviation. (B) Z-stack of A. thaliana upper epidermis expressing FNRtp:eGFP (the same image as in Figure 1D) with cells numbered and outlined in gray, nuclei in red (stomatal guard cells excluded from the analysis, in dark gray). Cells in the three different size categories colored in yellow (small cells), green (medium cells) and blue (large cells). Scale = 50 μm.

