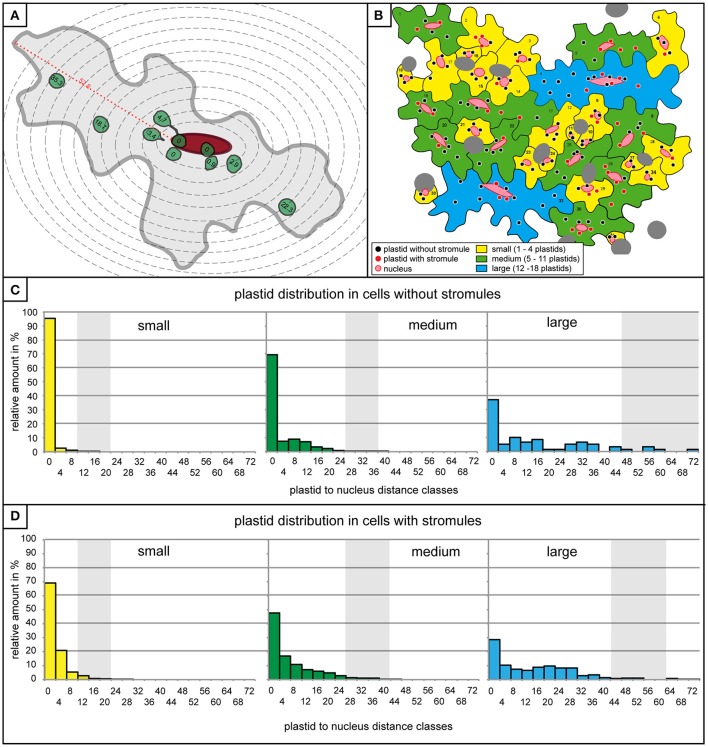
Figure 4.
Plastids distribution is similar in cells with and without stromules. (A) A graphic representation of a medium sized cell with 4 μm zone boundaries outlined with dotted gray lines, the nucleus in red, and the plastids with and without stromules are in green. Distance of all plastids to the nucleus (in μm) is written within the plastid. The maximum distance possible between a plastid and the nucleus (i.e., the longest distance between the nucleus and the cell border) is highlighted with a red dotted line and marked with the distance measurement for this particular cell. (B) A graphic representation of the microscopy picture found in Figures 1D, 2B, demonstrating the distribution of plastids in cells with and without stromules in the different cell size categories. (C,D) Histograms exhibiting the number of plastids within each 4 μm zone (x-axis) in small (yellow), medium (green) and large (blue) cells lacking stromules (C) and in cells with stromules (D). Thick vertical lines (light gray) represent the average maximum distance a plastid can be from the nucleus. Average maximum distance values were generated by measuring the maximum distance between the nucleus and cell border in each cell and averaging these values (example measurement highlighted by a red dotted line in A). The greatest distance possible between the nucleus and the plastid depends on cell size, but also nucleus position within the cell.

