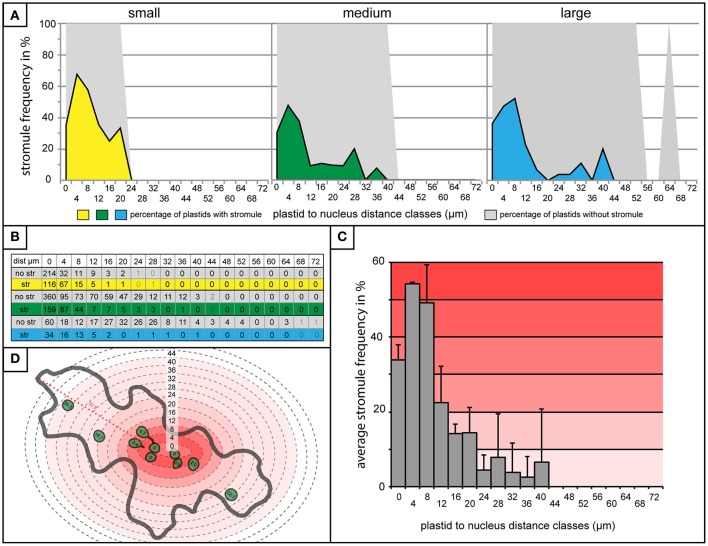
Figure 5.
“Stromule-promoting zone” evident within 8 μm of the nucleus. (A) Histograms showing stromule frequency in each 4 μm zone at increasing distances from the nucleus (x-axis) in small (yellow), medium (green), and large (blue) cells. Gray areas represent the frequency of plastids without stromules. (B) The plastid sample sizes for each 4 μm zone which was illustrated in the histograms in (A). (C) Histogram of stromule frequency in each 4 μm zone when data sets from all cell sizes are combined. Highest to lowest stromule frequencies are indicated with a dark-light red gradient background. Error bars represent standard deviation. (D) An illustrated example of a cell highlighted according to the stromule frequency gradient outlined in (C). Defined distance classes from histogram in (C) superimposed onto illustration (this particular cell has plastids in zones up to 40 μm from the nucleus).

