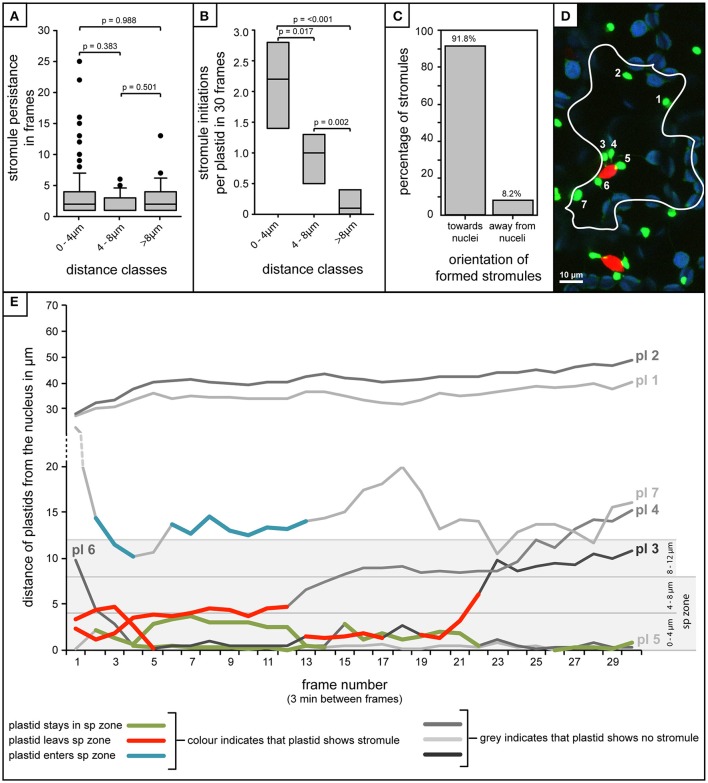
Figure 7.
Stromule enrichment in close proximity to the nucleus is due to an increase in formation events, and not to an increase in stromule persistence over time. (A–C,E) Quantification of stromule behavior resulting from the frame-by-frame analysis of 90 min movies (30 frames, 3 min/frame). (A) Box plot showing the persistence of stromules with increasing distance from the nucleus as measure by the number of frames individual stromules persist for. Boxes represent 50% of all data, horizontal line within boxes represents the median, and error bars represent 90th percentile. p-values resulting from Rank-Sum tests comparing treatments can be found above brackets identifying treatments used for comparisons. (B) Box plot representing the number of stromule initiations observed per plastid in each distance class over a period of 90 min (n = 7 videos). Boxes represent 50% of all data, median is represented by a horizontal line within boxes. p-values resulting from Rank-Sum tests comparing treatments can be found above brackets identifying treatments used for comparison. (C) Percentage of stromules facing toward and away from the nucleus (method for orientation evaluation outlined in Figures 6A,B). (D) Example of a single frame from a movie with a single cell outlined. Bright green plastids and red nuclei are organelles of the upper epidermis of an A. thaliana wild-type plant transformed with the pLSU4::pn plasmid (blue channel, chlorophyll fluorescence; red channel, H2B:mCherry fluorescence; green channel, FNRtp:eGFP fluorescence). Plastids were assigned numbers to track their identity over the course of the movie (also seen in white). Larger, round, blue signals represent underlying mesophyll plastids, where chlorophyll signal is brighter than the FNRtp:eGFP fluorescence signal. (E) Graph representing the movement of each plastid relative to the nucleus in the cell shown in (D) over the course of 30 frames/90min (Supplementary Movie 1). Each line represents a different plastid (labeled “pl #”), assigned numbers are shown in (D). Gray scale lines represent frames where the plastid has no stromule, while colored lines represent frames in which stromules are observed. The line with blue segments (pl 8) represents a case where the plastid starts out away from the nucleus, and as it moves closer stromules are initiated, while red lines (pl 3 and pl 4) both illustrate plastids that start close to the nucleus with a stromule, and following movement away from the nucleus they lose their stromule. Green indicates plastids that stay within the “stromule-promoting zone,” initiating one or more stromules over the course of the movie (pl 5 and pl 6).

