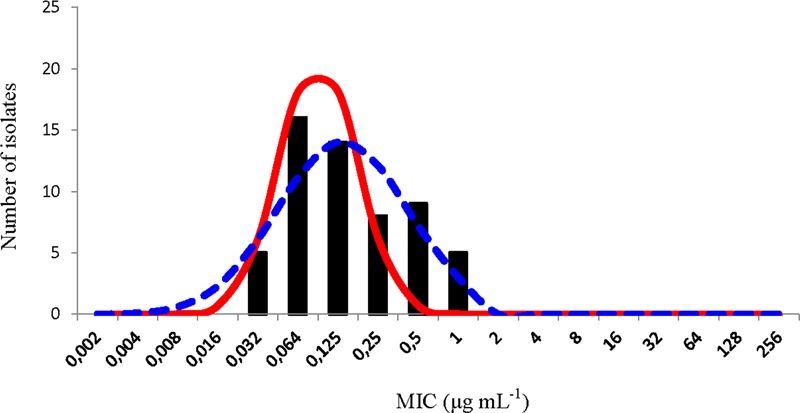
FIGURE 2.

Distribution of minimum inhibitory concentration (MIC) values of oxytetracycline of 58 Piscirickettsia salmonis isolates. The continuous red line represents the distribution of the normalized MIC values for the putative wild type (WT) observations calculated by the normalized resistance interpretation (NRI) analysis. The dashed blue represents the best fit line of the distribution of putative WT observations calculated by the ECOFFinder analysis.
