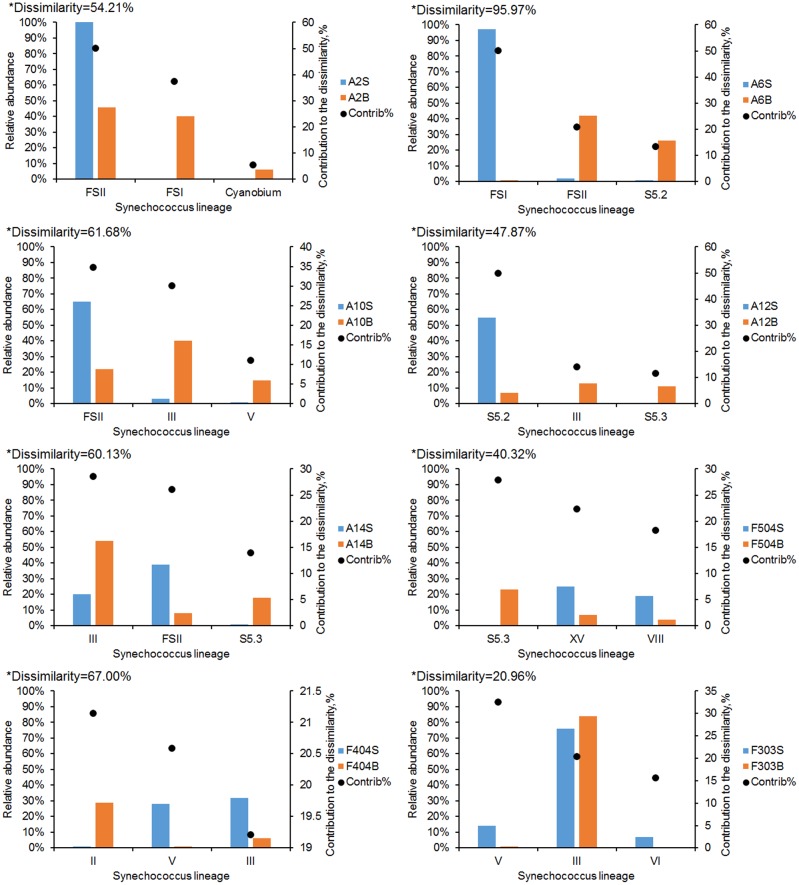
FIGURE 4.
SIMPER analysis of the dissimilarity between Synechococcus communities in the surface and bottom waters in each station. Bar charts show the relative abundance of the three Synechococcus lineages that contributed most to the dissimilarity of communities. ∗The dissimilarity between the surface and bottom Synechococcus communities.

