
Fig. 5.
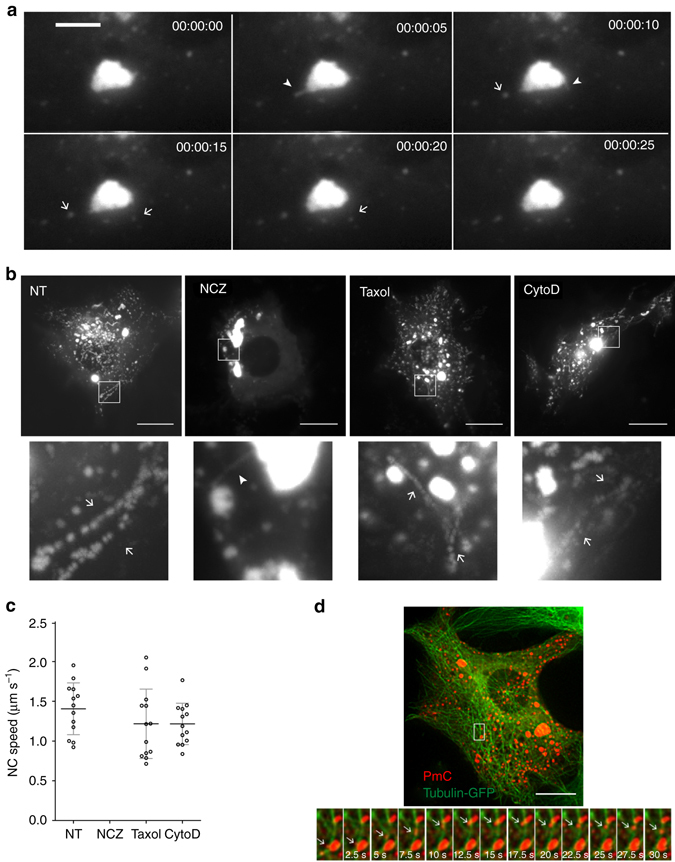
RNPs are ejected from NBs and transported along the microtubule network. Live cell imaging was performed on BSR cells infected by rCVSN2C-P-mCherry at a MOI of 0.5 at 16 h p.i. a Ejection of RNPs from NBs. The time is indicated in the upper right corner. Images have been extracted from Supplementary Movie 6 and are shown at 5-sec intervals. Ejection events are observed on a single image and indicated by arrowheads. The resulting RNPs are indicated by arrows. Scale bar corresponds to 3 µm. b Impact of cytoskeleton-disrupting drugs on RNPs transport in the cytosol. Nocodazole (NCZ, 2 µM), Taxol (1.25 nM) and Cytochalasin D (Cyto D, 2.5 µM) were added 1 h before and kept all along infection (NT: non-treated cells). 120 frames (one frame per 1 s, reflecting 120 s) of time-lapse microscopy (such as Supplementary Movie 7) are displayed as maximal intensity projection in order to visualize RNP trajectories which are indicated by arrows in the magnification shown in the lower row. In the NCZ-treated cell (Supplementary Movie 8), an ejection event is indicated by an arrowhead showing that RNP ejection from NBs occurs in absence of an intact microtubule network. Scale bars correspond to 15 µm. c Velocity of RNPs in the cytosol in non-treated and treated cells. The speed and the trajectories of RNPs were determined as described in the experimental procedures. Only the RNPs that were tracked on four consecutives images were taken into account. The mean is shown with error bars representing the SD. d RNPs are transported along microtubules. BSR cells were co-infected with rCVS N2C-P-mCherry and a modified baculovirus encoding human tubulin-GFP (Cell-light Tubulin-GFP). Images were deconvoluated using the Huygens Imaging software (Supplementary Fig. 5). Scale bar corresponds to 15 µm. Images have been extracted from Supplementary Movie 9 and are shown at 2.5-s intervals (bottom row)