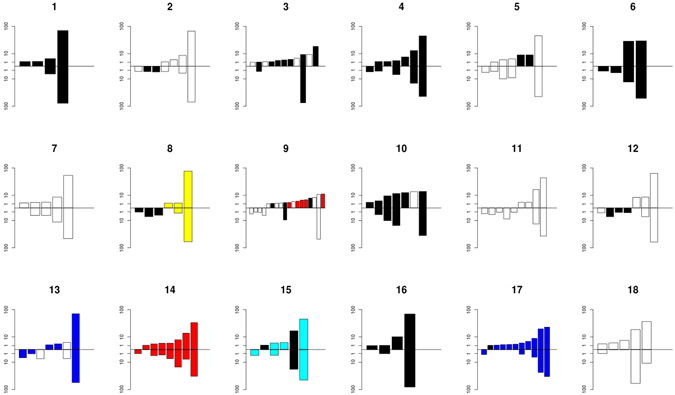
Figure 4.

The number and variation of HCV haplotypes in 18 paired liver and plasma samples. The graphs indicate the number and frequency of each haplotype with a resistance mutation. The upper bars indicate the liver samples, whereas the lower bars represent plasma samples from the same patient (indicated by a number above the graphs). The colours represent different variants: Black, C316N; Red, C316H+V321I; Blue, Q309R; Cyan, C316N+Q309R; Yellow, C316Y+Q309R. Only haplotypes with a cut-off of a frequency of 1% or higher per haplotype are depicted.
