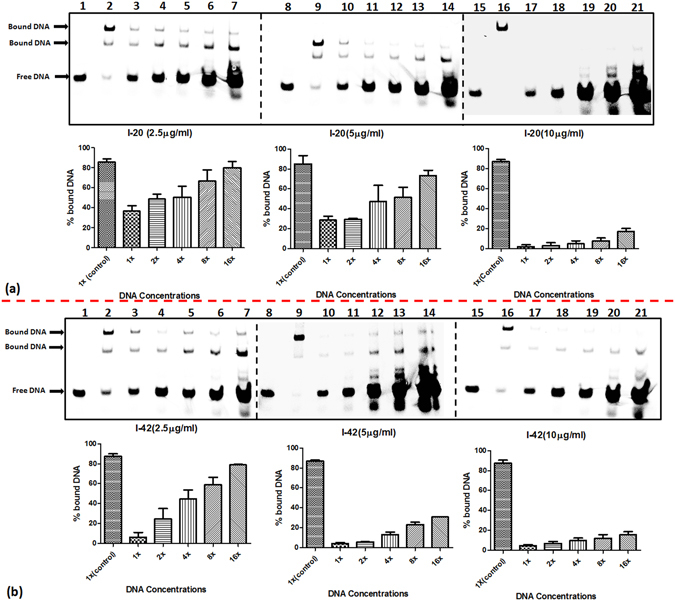
Figure 4.

Competition experiments with compounds I-20 and I-42 and labeled DNA. Each gel depicts the alleviation of inhibition exhibited by compound I-20 (a) and compound I-42 (b) in the presence of increasing DNA. Lanes 1, 8, 15- free DNA (0.8 pmoles), lanes 2,9,16- IdeR+DNA (0.8 pmoles)+DMSO (vehicle control), lanes 3, 10, 17- IdeR+DNA (0.8 pmoles)+ inhibitor, lanes 4, 11, 18 - IdeR+ DNA (1.6 pmoles)+ inhibitor, lanes 5, 12, 19 - IdeR+DNA (3.2 pmoles)+ inhibitor, lanes 6, 13, 20 - IdeR+DNA (6.4 pmoles)+ inhibitor, lanes 7, 14, 21 - IdeR+DNA (12.8 pmoles)+ inhibitor. The bar diagram represents the percent bound DNA at varying DNA concentrations (x represents 0.8 pmoles of labeled DNA, dotted lines represent separate gels). The data is represented as Mean ± S.E.M by values obtained from two independent experiments.
