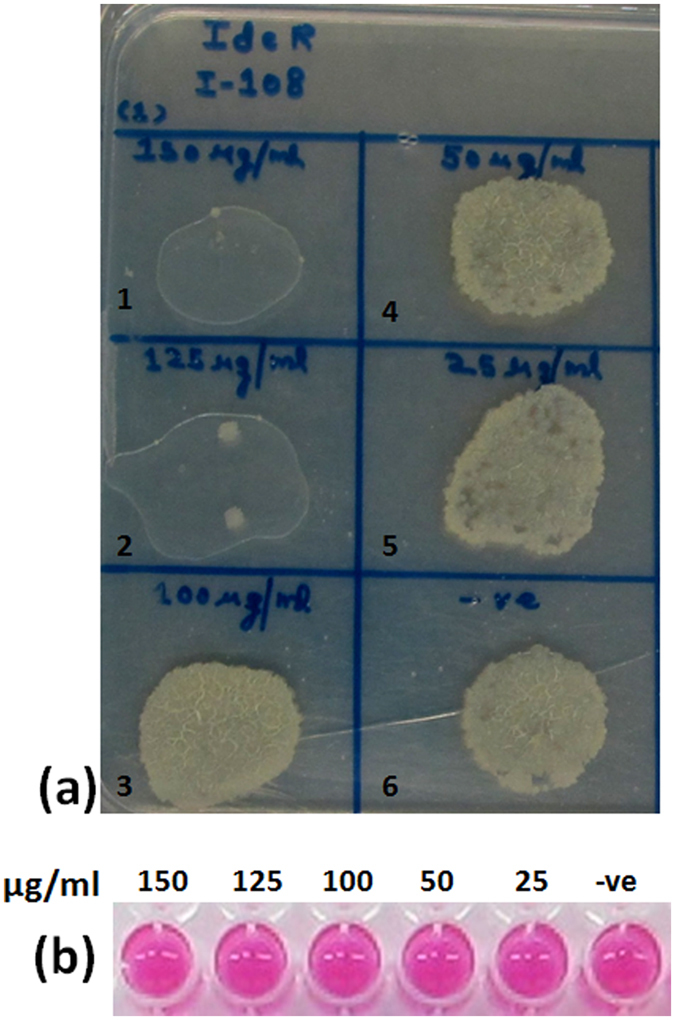
Figure 8.

Evaluation of inhibitory potential of compound I-108 against the growth of intracellular M. tuberculosis. (a) The influence of varying concentrations of I-108 on the growth of intracellular M. tuberculosis as analyzed on the agar plates. Panel a depicts the emergence of pin point colonies at the concentrations of 150 μg/ml and 125 μg/ml as compared to prominent growth of bacilli at lower concentrations of I-108. (b) Alamar blue assay to measure the viability of uninfected THP-1 cells in the presence of varying concentrations of I-108. The upper lane of panel b depicts the various concentrations of I-108 employed for the alamar blue assay (in μg/ml). Lanes 1–6 in panel a depicts following concentrations of I-108: Lane 1–150 μg/ml, Lane 2–125 μg/ml, Lane 3–100 μg/ml, Lane 4–50 μg/ml, Lane 5–25 μg/ml, Lane 6- -ve (only cells).
