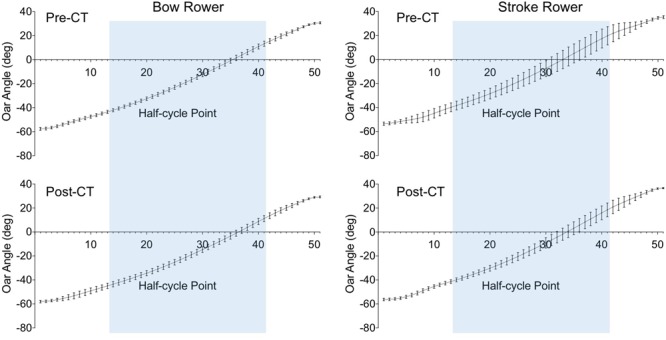
FIGURE 4.

Average time-normalized half-cycles for oar angle from catch (point 1) to finish (point 51) for the bow (Left) and stroke (Right) rowers during the pre-CT (Upper) and post-CT (Lower) sessions. Error bars present the standard deviations over 340 half-cycles. The blue area indicates the common part of the drive phase (between points 14 and 42).
