
Figure 3.
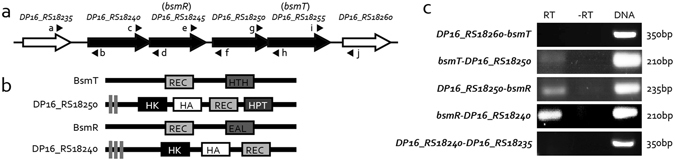
RT-PCR analyses demonstrate DP16_RS18240-bsmR-DP16_RS18250-bsmT as a tetra-cistronic operon. (a) Genomic localization of the bsmR gene. Arrows indicate the genes and their transcriptional directions. The black arrows indicate genes predicted to be in an operon. Black triangles around the arrows indicate the positions of the primers used in the RT-PCR assay. Gene names are listed above. (b) Putative secondary protein structures of BsmT, DP16_RS18250, DP16_RS18240, and BsmR. Protein structures were predicted by searching the Pfam database. (c) bsmR operon structure analysis by RT-PCR. RT: Amplification was carried out using cDNA transcribed from total RNAs as the template. −RT: cDNA synthesis in the absence of reverse transcriptase (negative control); DNA: PCR amplification with total DNA of S. maltophilia as the template (positive control). The data are representatives of triplicate repeatable experiments.