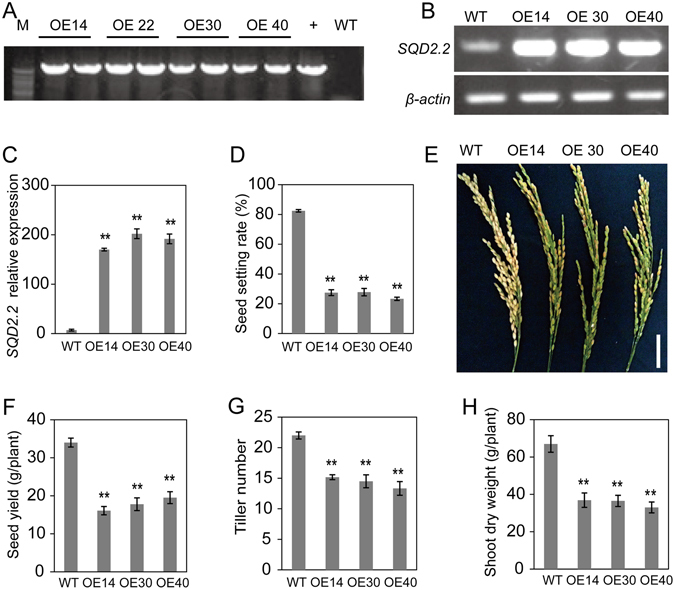
Figure 1.

Overexpression of SQD2.2 resulted in a reduced seed setting rate and tiller number. (A) Identification of transgenic plants using PCR. (B) and (C) SQD2.2 overexpression in the transgenic plants was confirmed via semi-quantitative RT-PCR and quantitative real-time PCR. Values are the mean ± standard error (SE) (n = 3). (D) and (E) Seed setting rate. Values are the mean ± SE (n = 10). (F) Seed yield per plant. Values are the mean ± SE (n = 10). (G) The tiller number per plant. Values are the mean ± SE (n = 6). (H) Shoot dry weight per plant. Values are the mean ± SE (n = 10). Student’s t test; **P < 0.01. Scale bar = 5 cm.
