
Fig. 2.
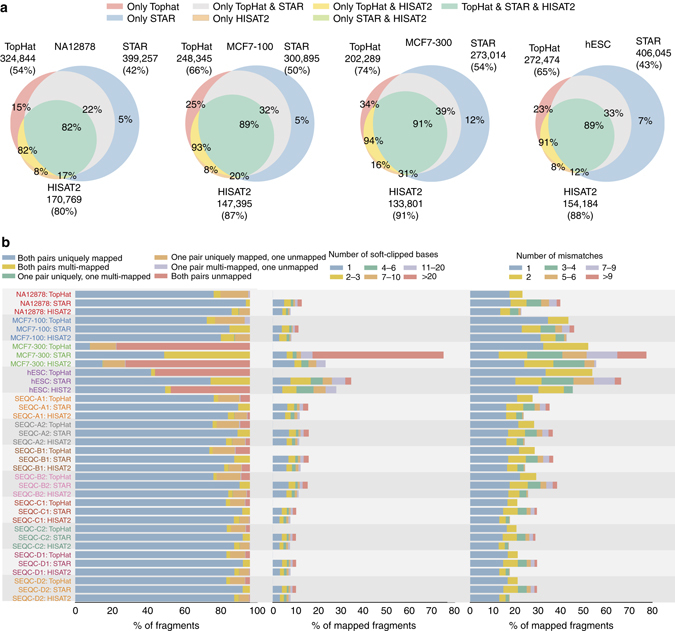
Performance of different alignment schemes. a Overlap between the detected splice junctions by different schemes and their validation rate on reliable junctions in dbEST database74. A reliable EST junction set consists of junctions supported by at least two ESTs. The sizes of the circles reflect the number of junctions called by each scheme. For each tool, the number of junctions called and the validation rates (in parentheses) are shown. Validation rates for each subset of junctions are also shown on the Venn diagram. b Read mapping analysis: distribution of mapping status of sequenced fragments (left) (for NA12878, MCF7, and SEQC samples, mapping status for paired-end reads are shown, while for hESC, the distribution reflects percentage of uniquely mapped (blue), multi-mapped (orange), and unmapped (red) single-end reads), distribution of number of soft-clipped bases in mapped fragments (middle), distribution of the number of mismatches in mapped fragments (right)