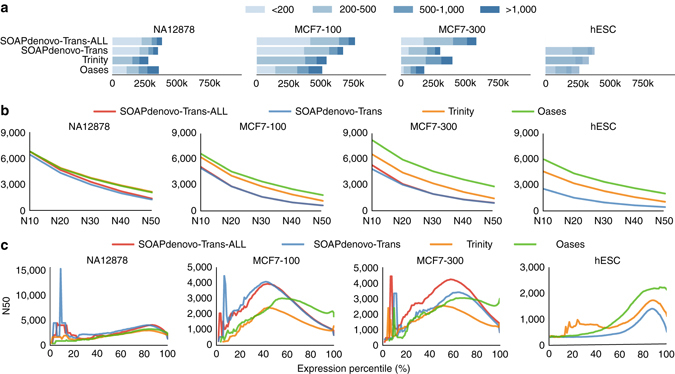
Fig. 4.

Performance of different de novo transcriptome assembly techniques. a Distribution of transcript length. b N10-N50 values. (Nx is the contig length for which at least x% of the assembled transcript nucleotides were found in contigs that were at least of Nx length.) c ExN50 value at different expression percentiles. For ExN50, the N50 statistic was computed at percentile x, for only the top most highly expressed transcripts that represent x% of the total normalized expression data. Expression values were measured using eXpress
