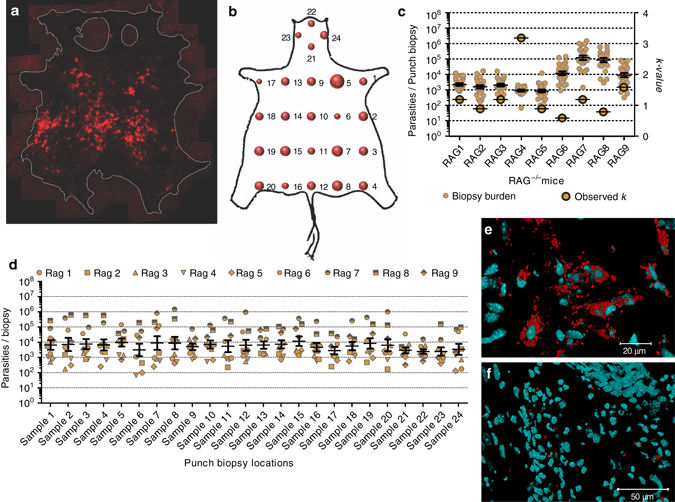
Fig. 1.

Analyzing skin parasite load and distribution. a Composite image of tdTom-expressing L. donovani parasites (red) in the skin of a representative infected RAG mouse (RAG9), imaged from the hypodermal face by fluorescent stereomicroscopy (see Supplementary Fig. 1 for more details). Skin edges were marked for better contrast. b Bubble plot of accumulative biopsy data for all RAG mice (biological replicates N = 9; see Supplementary Fig. 2 for more details). c Scatter plot of parasite loads per skin biopsy for each mouse (ø 0.8 cm; vol. 12 mm3; technical repeats N = 24 per mouse; left y-axis) and observed k-value for parasite distribution for each mouse (right y-axis). Mean and standard errors are shown for parasite load data. Skin-biopsy parasite load variability per mouse were analyzed by two-tailed one-sample t-test (P < 0.001 each), data variance between all mice (biological replicates N = 9) within the group by Brown-Forsythe test (P < 0.001) and mean biopsy parasite load by one-way Kruskal-Wallis test (P < 0.001). d Scatter plot for parasite density per biopsy location for all 24 biopsy locations across all mice (biological replicates N = 9 per biopsy site, total N = 216) analyzed by one-way Kruskal-Wallis test (P = 0.996). Mean and standard error bars are shown. e, f Magnified z-stack tile-scan images of skin areas containing heavily e and sparsely f parasitized mononuclear cells (full image in Supplementary Figs. 4, 5, respectively). Scale bars: 20 µm in e, 50 µm in f
