Fig. 2.

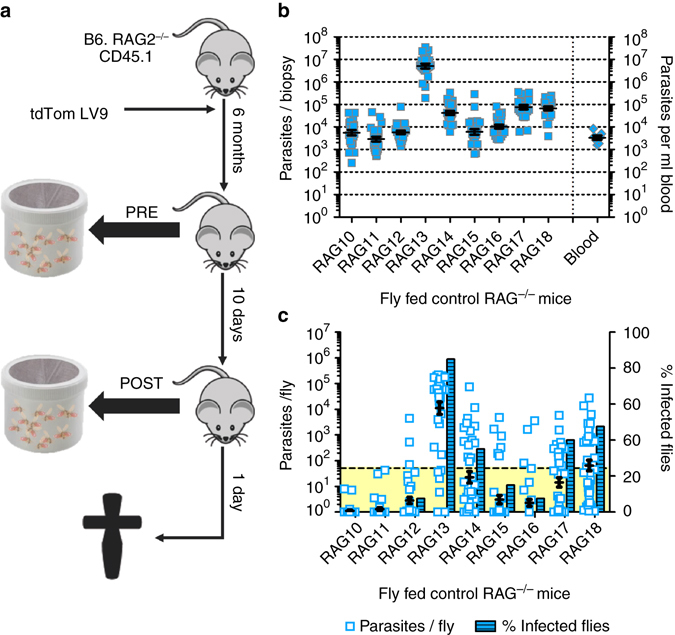
Analyzing impact of skin parasite burden on outward transmission. a Schematic representation of the experimental sand fly exposure procedure. b Scatter plot of parasite loads in skin for each mouse (ø 0.8 cm; vol. 12 mm3; technical repeats N = 24 biopsies per mouse; total N = 216) and blood parasitemia (per ml; biological replicates N = 9) of each mouse. Mean and standard error bars are shown. Skin parasite load variability per mouse was analyzed by two-tailed one-sample t-test (P < 0.001 each), data variance between all mice (biological replicates N = 9) within the group by Brown-Forsythe test (P < 0.001) and mean biopsy parasite load by one-way Kruskal-Wallis test (P < 0.001). c Experimental qPCR data of parasite loads per sand fly after the second mouse exposure (scatter plot; technical replicates N = 40 per mouse, total N = 360) paired with the ratio (%) of sand flies harbouring >50 parasites (threshold area in yellow) at day 7 PBM (bar chart). Mean and standard error bars are shown (Scatter plot only). Sand fly parasite load variability between sand flies fed on the same mouse were analyzed by two-tailed one-sample Wilcoxon signed-rank test (P < 0.001 each), sand fly data variance between Fly Fed control mice (biological replicates N = 9) by Brown-Forsythe test (P < 0.001) and mean sand fly parasite burden by one-way Kruskal-Wallis test (P < 0.001)
