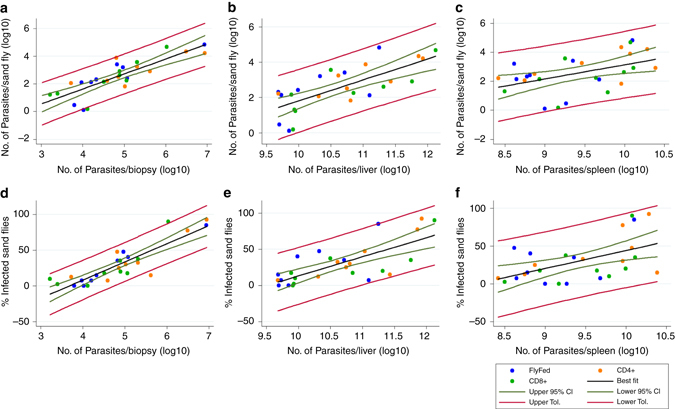
Fig. 3.

Correlating tissue parasite load to outward transmission success. Correlation plots comparing sand fly parasite load (determined by qPCR) with host parasite loads in a skin, b liver and c spleen (all determined by qPCR). Correlation plots comparing frequency of infected sand flies with host parasite loads d skin, e liver and f spleen (all determined by qPCR). Mice from all experimental groups were included in the analyses, but represented by group in the plots (see legend). The graphs show the line of best fit (black), the 95% confidence intervals (CI; green) and the tolerance bands (red). All qPCR data were log10-transformed prior to analysis. Biological replicates N = 9 per group, total N = 36
