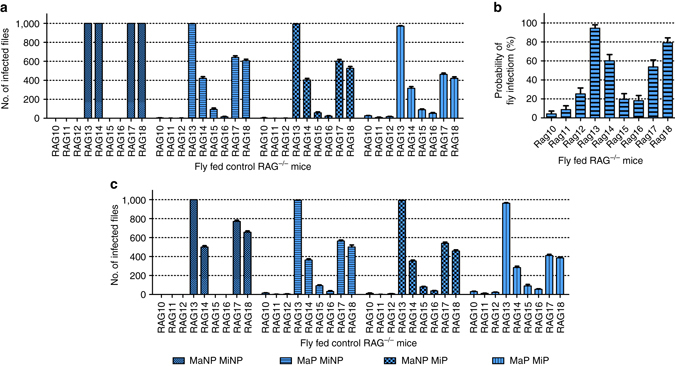
Fig. 5.

Predicting outward transmission potential by distribution. a Model predicting host infectiousness to sand flies using fixed parameters (infection threshold = 1000 amastigotes, blood pool volume = 0.19 mm3, fly feed volume = 1.6 mm3). Either a macro-(Ma)/micro-(Mi) scale homogeneous (MaNP MiNP; NP = non-patchy), a macro-scale patchy micro-scale homogeneous (MaP MiNP; P = patchy), a macro-scale homogeneous micro-scale patchy (MaNP MiP) or a macro-/micro-scale patchy (MaP MiP) distribution is assumed. Graphs are based on 10 model iterations. Standard error bars are shown. b Estimation of probability of sand fly infection based on experimental sand fly data. Graphs are based on 10 model iterations. Standard error bars are shown. c Model predicting host infectiousness with infection threshold reduced to 500 amastigotes, a 50% amastigote loss post ingestion and with uniformly random blood pool volumes (0.05–0.42 mm3) and fly feed volumes (0.1–1.6 mm3). Either a macro-(Ma)/micro-(Mi) scale homogeneous (MaNP MiNP; NP = non-patchy), a macro-scale patchy micro-scale homogeneous (MaP MiNP; P = patchy), a macro-scale homogeneous micro-scale patchy (MaNP MiP) or a macro-/micro-scale patchy (MaP MiP) distribution is assumed. Model outcomes are based on experimental results obtained from the Fly Fed control RAG mice as shown in Fig. 2b. See Supplementary Fig. 16 for a similar analysis using data from RAG mice receiving CD4+ or CD8+ T cells
