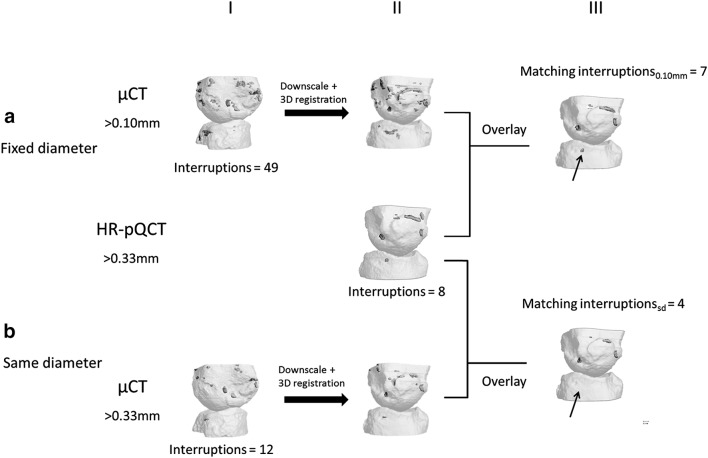
Fig. 2.
Matching interruptions between HR-pQCT and µCT with a variable minimum diameter on HR-pQCT and fixed minimum diameter of >0.10 mm on µCT (a), and with the same variable minimum diameter on HR-pQCT and µCT (b). I Represents the outputs of the cortical interruption algorithm on µCT. The µCT image is downscaled and registered to the HR-pQCT output image (II). The µCT and HR-pQCT images are overlayed, and interruptions with at least 20 HR-pQCT voxels overlap are shown in (III). The black arrow indicates an interruption that was found matching on HR-pQCT and µCT in (a) with a fixed minimum diameter on µCT (matching interruptions0.10mm), but was not found matching with the same minimum diameter (b, matching interruptionssd)

