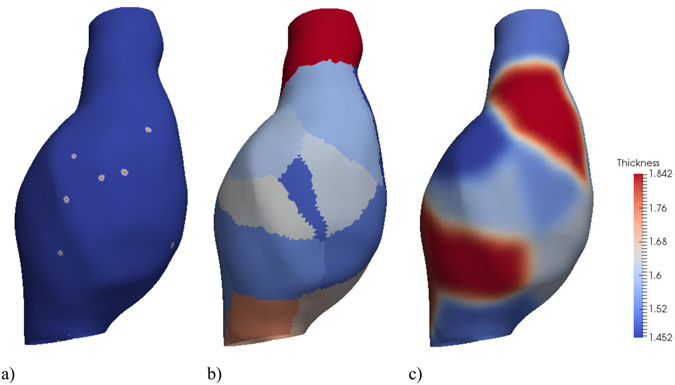
Figure 11.

Example of thickness interpolation for an AAA. (a) Thickness measurements points. (b) Areas of the surface discretization associated with each measurement point (similar to a Voronoi diagram in plane) – the thickness at the measurement point will be extended to these areas. In this image the colors are determined by the measurement point id – for illustration purposes, only a limited number of measurement points are defined in order to have a clear separation of these areas. (c) Thickness values (using 10 smoothing iterations) [mm].
