
Figure 2.
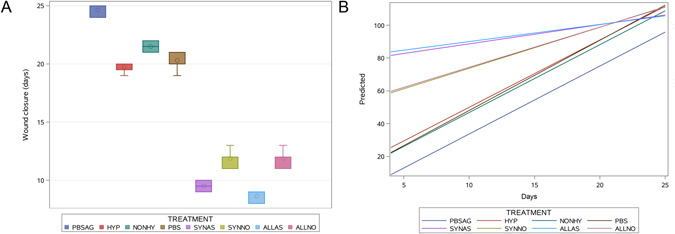
The wound healing: time to wound closure presented as a box plots (A), and regression analysis of wound reduction with predicted values of various treatment groups plotted versus time, expressed as days for various treatment options (B). SYNAS – young, syngeneic cells + AA, ALLAS – young, allogeneic cells + AA, SYNNO – young, syngeneic, non-preconditioned cells, ALLNO – young, allogeneic, non-preconditioned cells, PBS – control side young animals, HYP – adult, hypoxic, NONHY – adult, non-hypoxic, PBSAG – control side in adult animals. The boxes represent interval between 25 and 75 percentile, and whiskers the minimum and maximum values.