
Figure 7.
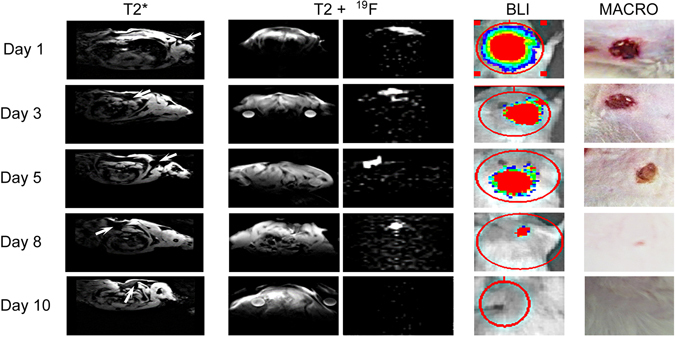
Imaging time course of ASCs and macrophotographs showing the process of wound-healing on an example of transplantation of AA-preconditioned, syngeneic, SPIO- or 19F-labeled ASCs to young animals. The 19F images, BLI, and MACRO pictures belong to the same animal, while T2* images were derived from another animal. Arrows indicate the hypothetical location of iron oxide-labeled cells on T2* MRI, but data are inconclusive. 19F MRI shows clear hot spot images of cell deposits. T2w MRI presents an anatomical reference for 19F MRI. The BLI signal is represented as a color-coded map. The macro pictures depict the time course of wound-healing.