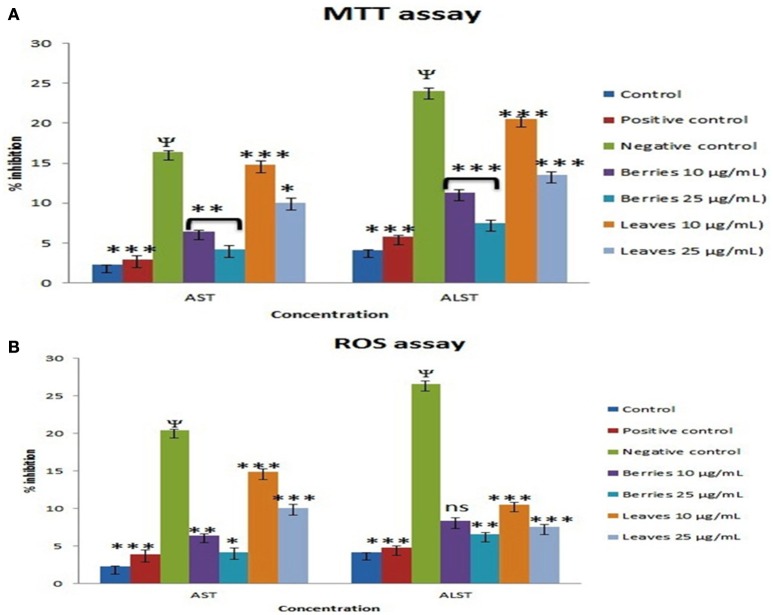
Figure 6.
Effect of SGAs enriched fraction on hepatic marker enzyme by (A), MTT and (B), ROS. Each value is represented as mean ±SEM, n = 6, Ψ P < 0.01 when toxic control compare with control, ns, Non significance. *P > 0.05, **P < 0.01, ***P < 0.001 vs. toxic control, One way ANOVA followed by Dunet's test.

