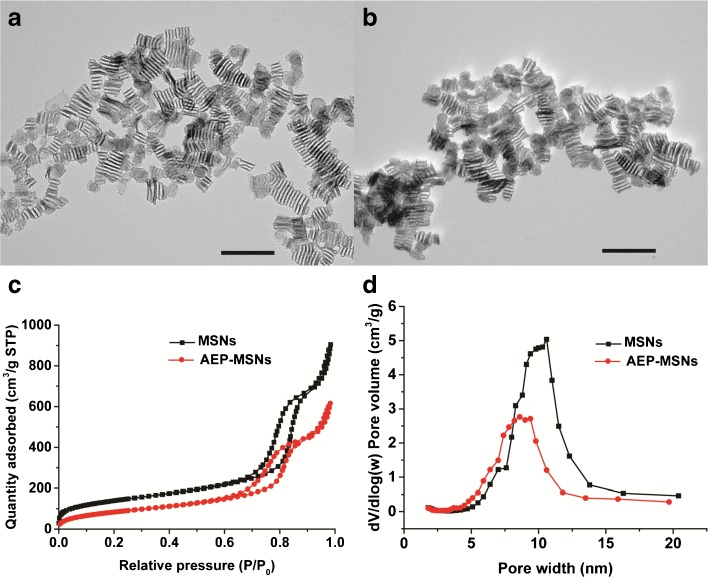
Fig. 1.
Characterization of the MSNs and AEP-MSNs. TEM images of (a) MSNs and (b) AEP-MSNs. Scale bar = 200 nm. (c) Nitrogen adsorption-desorption isotherms and (d) plots of pore diameter vs. pore volume (inset), calculated from the desorption isotherms using BJH model, show that the MSNs and AEP-MSNs have an average pore diameter of 10 nm and 9 nm, respectively.

